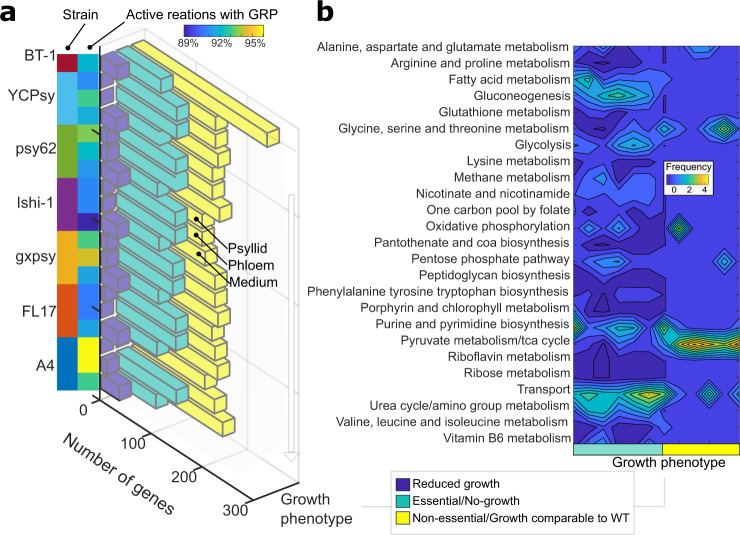
Fig. 5. Predicted gene essentiality by strain and host.
a Breakdown of phenotypes of all the genes in the metabolic models. Gene essentiality predictions are shown for all six CLas strains and BT-1. Phenotypes are binned into three categories based on predicted growth rate after individual gene knock-out; no growth (essential genes-green), reduced growth rate (blue), and comparable growth rate to wild-type conditions (non-essential-yellow). The gene essentiality results are plotted for each strain under the three different constraint datasets (psyllid RNA-sequencing data, psyllid; phloem RNA-sequencing data, phloem; and culture medium M15, medium). Note that L. crescens BT-1 only contains predictions for the culture medium, because it is not a pathogen found in either the psyllid or the citrus phloem. Percentage of active reactions with gene-protein-reaction association during the simulation of non-essential genes is shown in the blue-to-yellow heatmap. b The contour plot shows the number of CLas genes that have unique phenotypes across the three constraint datasets, meaning that some genes that are non-essential in culture medium became essential when constrained by host conditions. We found that genes reducing the growth rate were consistent among growth conditions, while categorizing genes as essential or non-essential depended on the host. The number of genes that changed between essential and non-essential categorization under different host conditions is binned by subsystem, where yellow means maximum six genes changed in the subsystem, and dark blue is no genes changed in the subsystem. The complete dataset is provided in Supplementary Tables 6 and 7.

