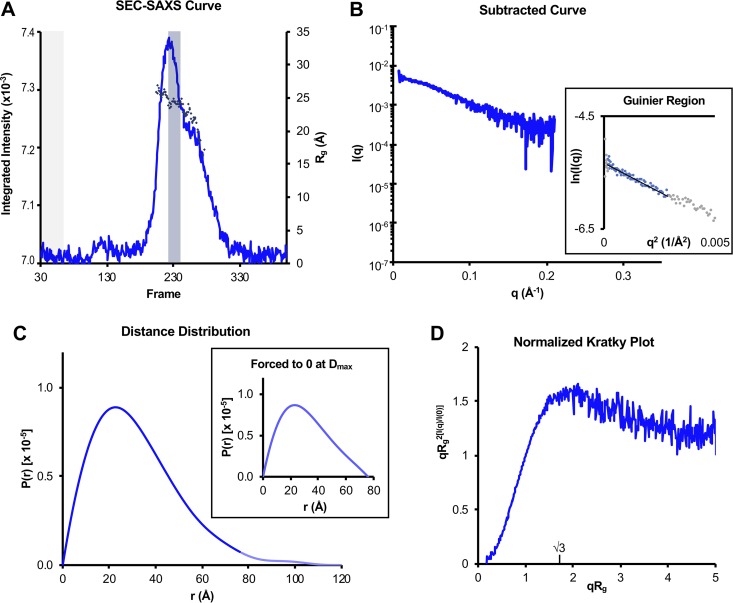
FIG 7.
SAXS analysis of UL11. (A) Trace of integrated scattering intensities for each frame collected in the UL11-StII SEC-SAXS experiment. Buffer curves (frames shaded gray) were averaged and subtracted from each scattering curve to calculate Rg (diamonds) frame by frame. Data from curves giving a consistent Rg within the major SEC peak (frames shaded blue) were averaged, and the buffer average was subtracted from this sample average to give the subtracted SAXS curve in panel B. (B) Subtracted SAXS curve for UL11-StII with Guinier plots (inset, including linear fits) at the low-angle region (qRg < 1.3). These regions were selected with AUTORG such that residuals were evenly distributed around zero. Data points in gray were excluded from the Guinier analysis. (C) Pair distance distribution functions [P(r)] for UL11-StII calculated from scattering curves in panel B, comparing curves calculated with Dmax forced to zero (inset) or not forced to zero (main panel). In the main panel, the faded blue line shows the continuation of the UL11 P(r) after the Dmax when forced to zero. (D) Normalized (dimensionless) Kratky plot was calculated from scattering curve in panel B. Parameters from these data are also summarized in Table 2. Data for UL11-StII have been deposited into the Small Angle Scattering Biological Data Bank (SASBDB) under code SASDEX4.

