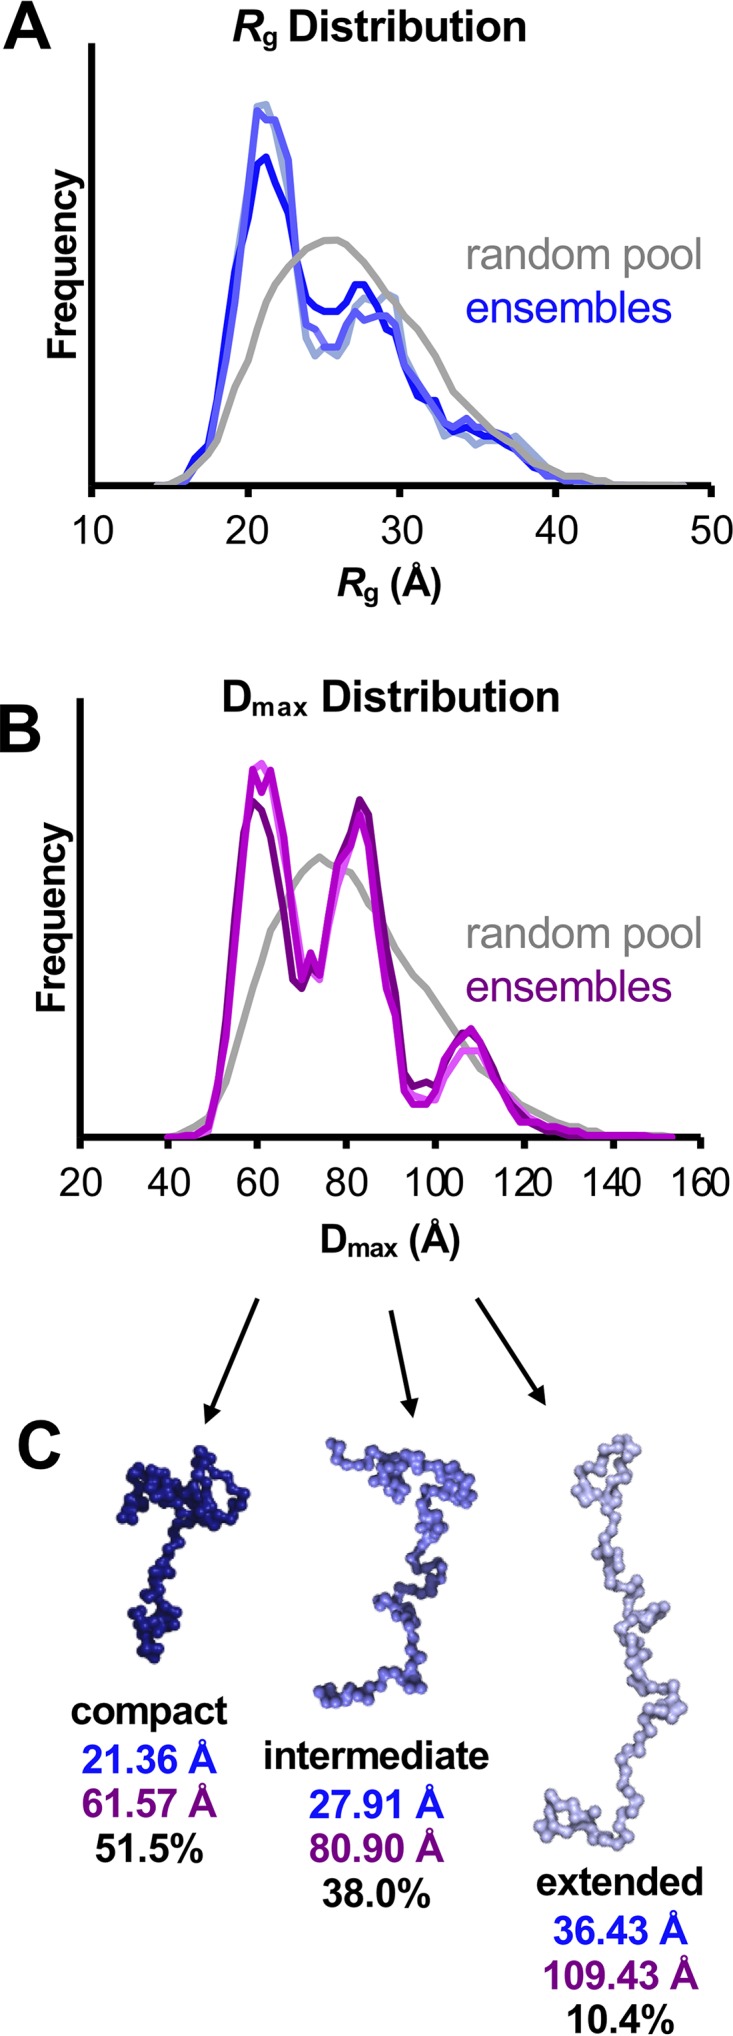
FIG 8.

Ensemble optimization modeling (EOM) of UL11-StII. (A and B) Histograms comparing the distribution of Rg values (A) and Dmax values (B) between a pool of 10,000 randomly generated structures (gray) and three independently optimized representative ensembles of structures (blues in panel A; purples in panel B) indicate the presence of three conformations. (C) Representative structures of the conformations found in the optimized ensembles are shown with the average Rg (blue) and Dmax (purple) values and the percentage of the ensemble they represent. These models suggest possible behavior of the flexible protein in solution, but they do not represent the only solution. These values are also summarized in Table 3.
