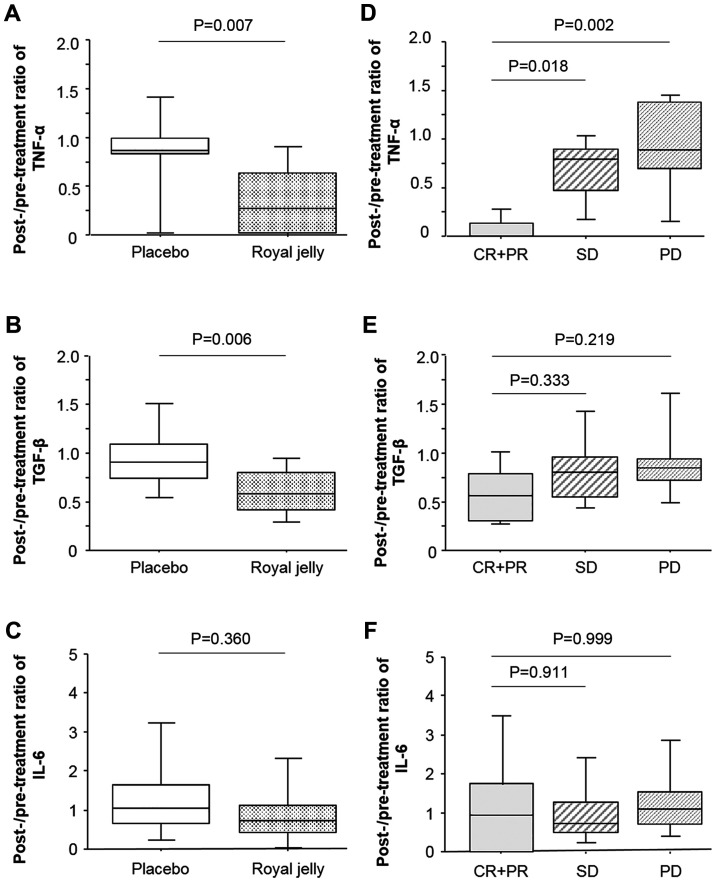
Figure 2.
Post/pre-treatment ratio of the levels of (A) TNF-α, (B) TGF-β and (C) IL-6 in the serum of patients in the placebo and royal jelly groups. Correlation between the ratios and tumor response after molecular targeted therapy and the ratios of (D) TNF-α, (E) TGF-β and (F) IL-6. Lower and upper whiskers indicate the minimum and maximum, respectively, of the data set. The box is drawn from the lower quartile to the upper quartile with a horizontal line drawn in the middle to denote the median. TNF, tumor necrosis factor; TGF, transforming growth factor; IL, interleukin.

