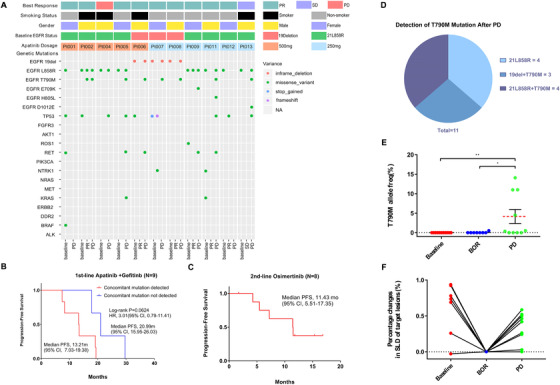
FIGURE 4.

Plasma circulating‐tumor DNA (ct‐DNA) sequencing description summary and clinical outcome exploratory analysis results of 11 patients. A, Mutation plots of sequencing profile at baseline, best of response, and after PD samples, were sorted by the apatinib dosage (500 or 250 mg). Each column represents a distinct patient. BOR, smoking status, and sex groups are shown at the top. B, Kaplan‐Meier curves of progression‐free survival (PFS) in patients whose ct‐DNA had concomitant mutations compared with those without concomitant mutations at baseline. (C) Kaplan‐Meier curves of progression‐free survival (PFS) in 8 patients who received Osimertinib after PD in the second‐line. D, Pie chart depicting the T790M resistant distribution. E, Scatter plot of EGFR‐T790M VAFs (%). The red dashed line represents the median (0 at baseline, 0.6375 at PR/SD, and 4.145 at PD). F, Percentage changes in SLD of target lesions correlated with T790M VAFs. Abbreviations: del, deletion; EGFR, epidermal growth factor receptor; HR, hazard ratio; NR, not reached; PD, progressive disease; PR, partial response; SD, stable disease; PD, progression disease and VAF, variant allele frequency; SLD, sum of the longest diameters
