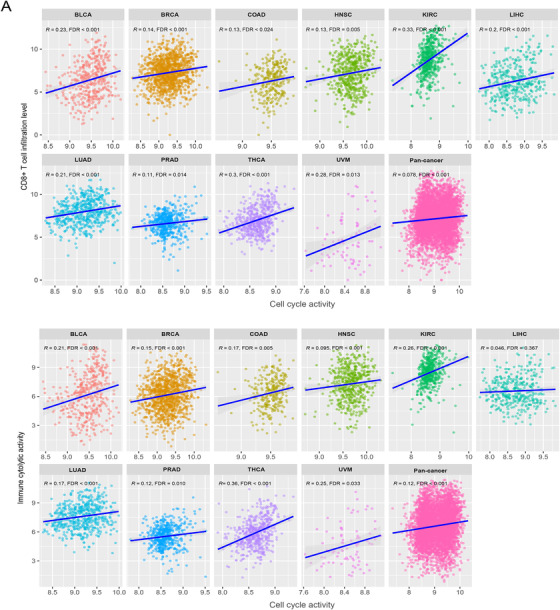
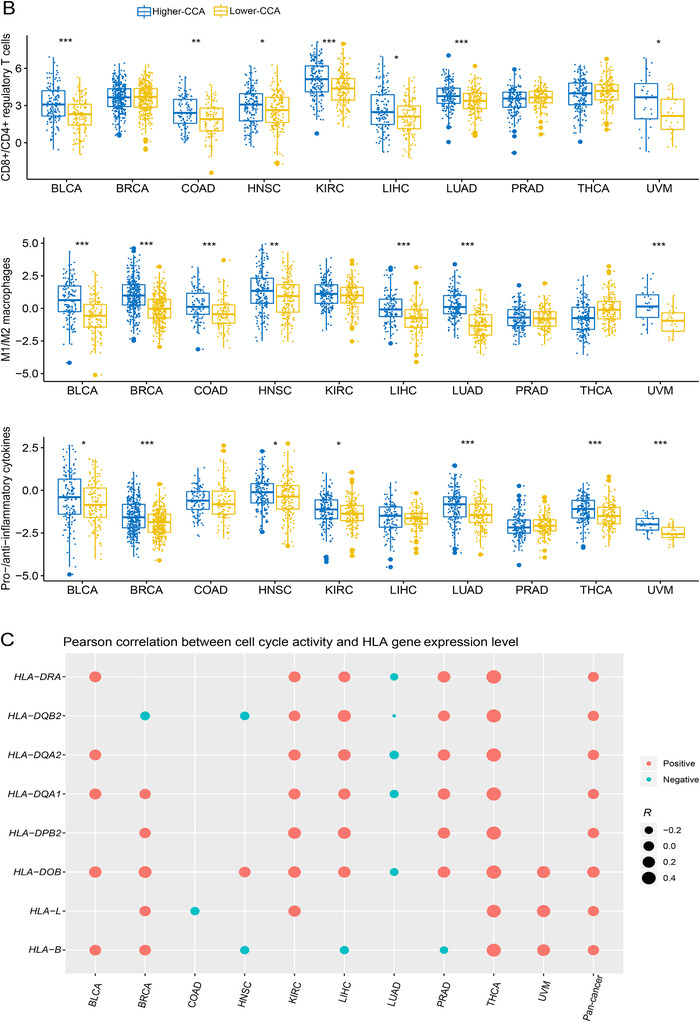
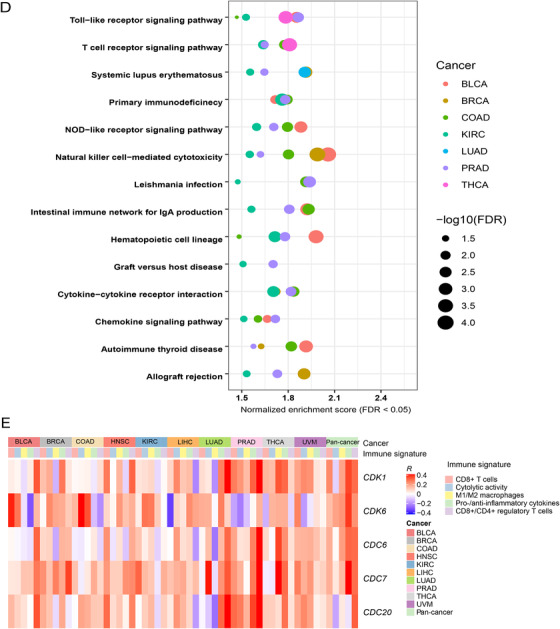
FIGURE 1.
Association of cell cycle activity with anti‐tumor immune signatures in pan‐cancer and in individual cancer types. A, Association of CCA with CD8+ T cell infiltration levels and immune cytolytic activity. Pearson's correlation test R and FDR are shown. CCA, cell cycle activity. It also applies to following figures. B, Comparison of the ratios of immune‐stimulatory to immune‐inhibitory signatures between higher‐ and lower‐CCA tumors. The Mann‐Whitney U test one‐sided FDR are indicated. The higher‐ and lower‐CCA tumors are the tumors whose CCA scores lie in the upper and bottom third, respectively. A ratio is the log2‐transformed ratio of the geometric mean expression level of all marker genes of an immune‐stimulatory signature to that of an immune‐inhibitory signature in a tumor sample. C, Association of CCA with the expression levels of human leukocyte antigen (HLA) genes. D, Immune‐related pathways which are highly enriched in higher‐CCA tumors in at least 5 individual cancer types identified by KEGG. E, Association of the expression of cell cycle pathway genes with anti‐tumor immune signatures. Pearson's correlation R values are indicated. FDR: false discovery rate, is the adjusted P values computed by the Benjamini and Hochberg method (*, FDR < 0.05; **, FDR < 0.01; ***, FDR < 0.001).


