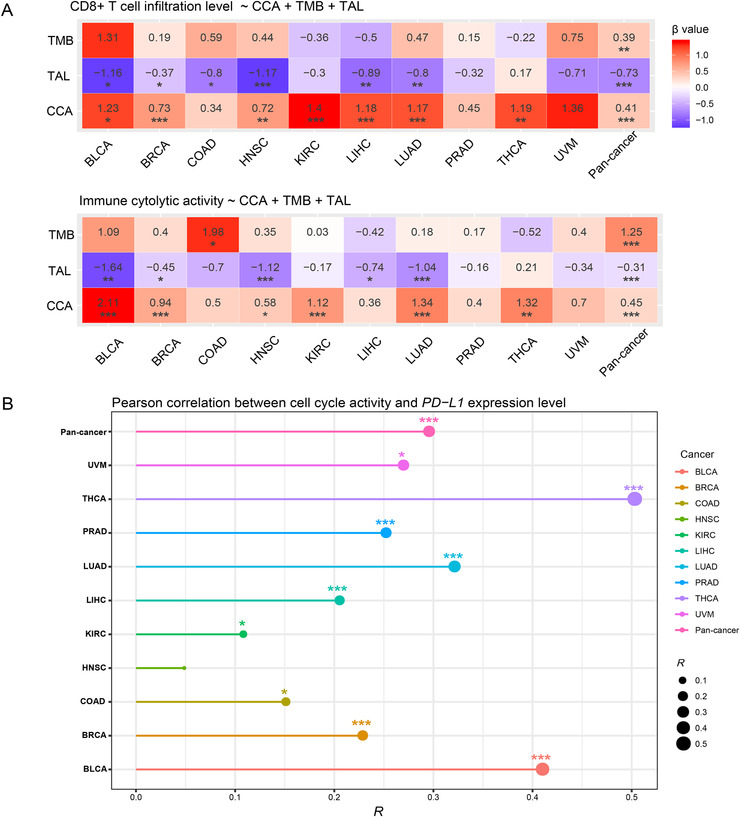
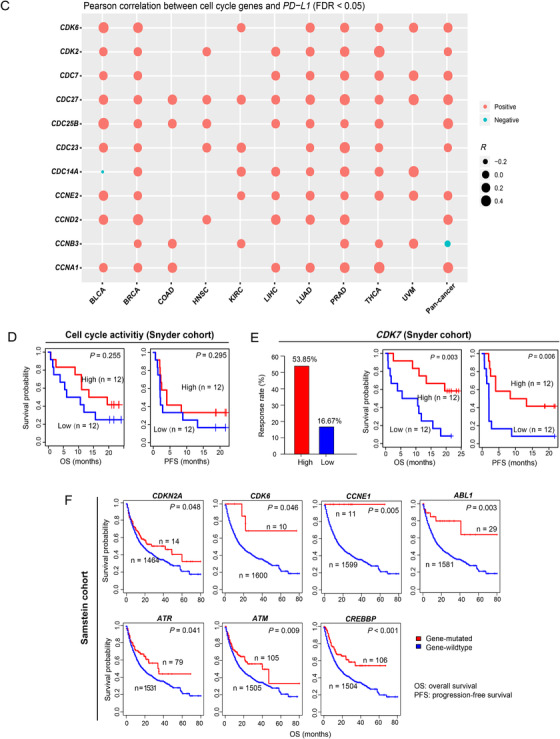
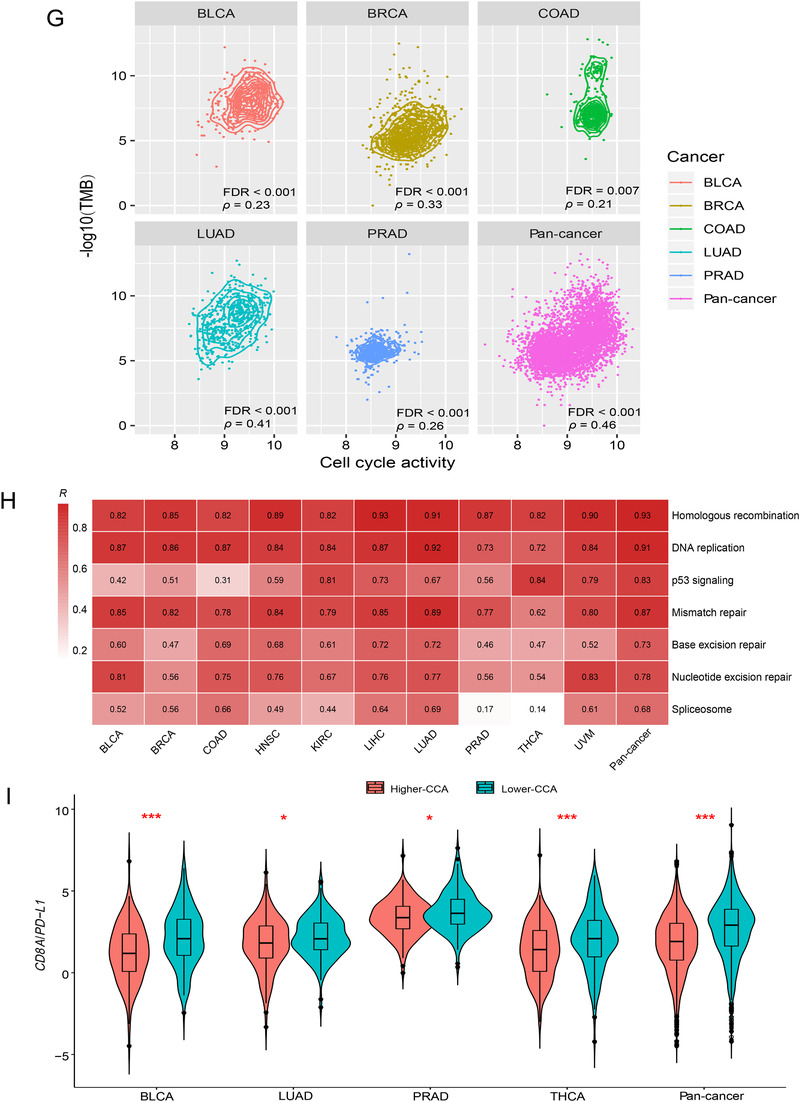
FIGURE 2.
Association of cell cycle activity with tumor mutation burden, tumor aneuploidy level, PD‐L1 expression, immunotherapy response, and DNA damage repair pathways. A, Logistic regression analysis of CCA, TMB, and TAL for predicting immune signatures (CD8+ T cell infiltration levels and immune cytolytic activity) in pan‐cancer and in individual cancer types. The tumor status of high (upper third) or low (bottom third) immune signature scores were predicted. TMB is the total somatic mutation count in tumor and tumor aneuploidy level is the ploidy score calculated by ABSOLUTE. β coefficients and P values for each predictor are shown. CCA, cell cycle activity. TMB, tumor mutation burden. TAL, tumor aneuploidy level. B, Association of CCA with PD‐L1 expression levels. Pearson's correlation test R and P values (FDR) are indicated. C, Association of the expression levels of cell cycle genes with PD‐L1. Pearson's correlation test R values are indicated. D, Kaplan‐Meier survival curves showing that higher‐CCA cancer patients have better survival trends than lower‐CCA patients in Snyder (urothelial cancer) cohort receiving anti‐PD‐L1 therapy. E, The elevated expression of CDK7 is associated with increased anti‐PD‐L1 response and better survival prognosis in Snyder cohort. F, Kaplan‐Meier survival curves showing that the mutations of many cell cycle pathway genes are associated with better overall survival in Samstein (pan‐cancer) cohort receiving anti‐PD‐1/PD‐L1/CTLA‐4 therapy (log‐rank test, P < 0.05). G, Significant positive correlations between CCA and TMB in pan‐cancer and in five cancer types. Spearman's correlation test ρ and adjusted P values (FDR) are shown. H, Association of CCA with the activity of DNA damage repair pathways. Pearson's correlation test R values are shown. I, The ratios of the mean expression levels of CD8A to PD‐L1 are significantly lower in higher‐CCA (upper third) than in lower‐CCA (lower third) tumors in pan‐cancer and in four cancer types. Student’s t test adjusted P values are shown (*, FDR < 0.05; **, FDR < 0.01; ***, FDR < 0.001).


