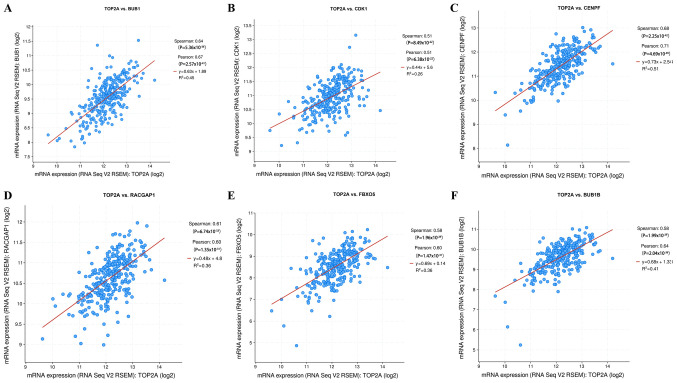
Figure 6.
Gene expression correlation analysis for BUB1, CDK1, CENPF, RACGAP1, FBXO5 and BUB1B with the TOP2A gene using cBioPortal. The scatter plot shows the Spearman's correlation of TOP2A expression with the expression of (A) BUB1, (B) CDK1, (C) CENPF, (D) RACGAP1, (E) FBXO5 and (F) BUB1B. BUB1, budding uninhibited by benzimidazoles 1; CDK1, cyclin-dependent kinase 1; CENPF, centromere protein F; RACGAP1, Rac GTPase activating protein 1; FBXO5, F-box protein 5; BUB1B, BUB1 mitotic checkpoint serine/threonine kinase B; TOP2A, DNA topoisomerase II α.

