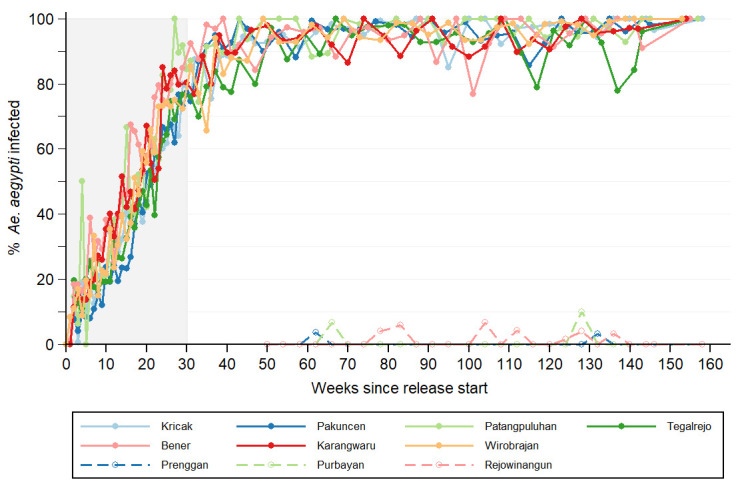
Figure 4. Wolbachia infection prevalence in local Aedes aegypti mosquito populations.

Lines show the percentage of Aedes aegypti collected from intervention areas (closed circles; solid line) and untreated control areas (open circles; dashed line) that were Wolbachia infected, each week since the start of deployments until September 2019. For the intervention areas, week 0 is the week in which deployment commenced (between 15 August and 18 September 2016, see Table 2). For the control areas, week 0 is the week in which the first deployments commenced in the intervention area (15 August 2016). Shaded area indicates release period.
