
Figure 10.
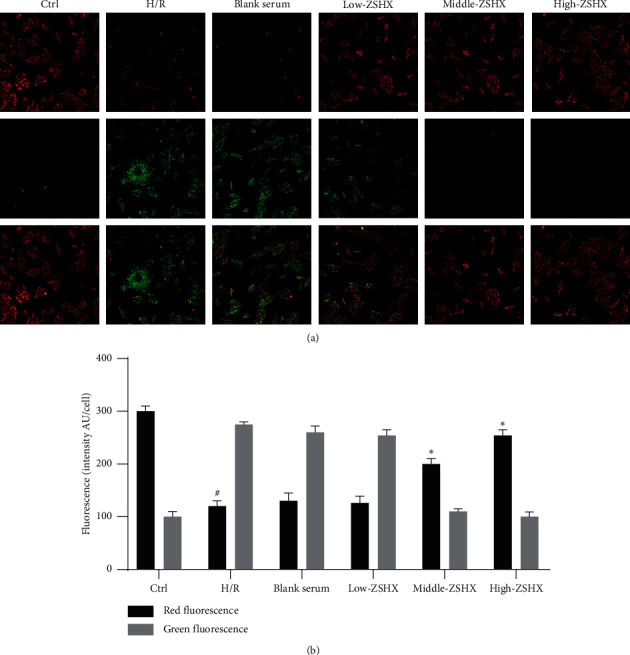
JC-1 was used to detect the mitochondrial membrane potential in each group. (a) Mitochondrial membrane potential fluorescence map; (b) mitochondrial membrane potential fluorescence value. Red fluorescence: J-aggregates green fluorescence: monomer scale is 10 microns. Compared with the Ctrl group, P < 0.05, and compared with the H/R group ∗P < 0.05.