
Figure 3.
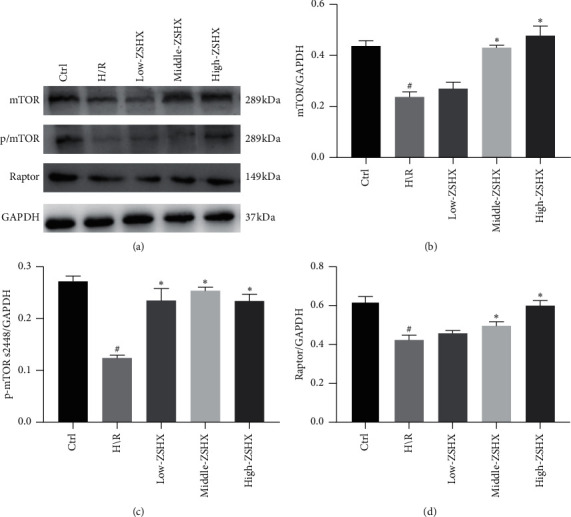
Proteins downstream of the mTORC1 pathway in each group. (a) The expression of macromolecule complexes of mTORC1 and phosphorylated; (b) mTOR protein in each group; (c) p/mTORS2448 protein expression; (d) Raptor protein expression. Compared with the CTL group, #P < 0.05, and compared with the H/R group, ∗P < 0.05.