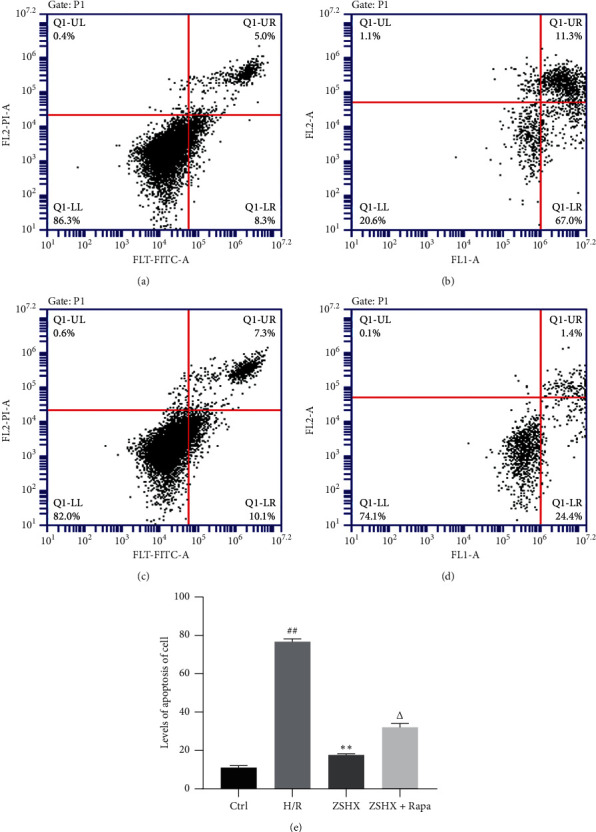
Figure 9.

Effects of each group on apoptosis of H/R myocardial cells. (a) Ctrl; (b) H/R; (c) ZSHX group; (d) ZSHX + Rapa group; (e) statistical map of cardiomyocyte apoptosis in each group. Compared with the CTL group, #P < 0.01, compared with the H/R group, ∗∗P < 0.01, and compared with the ZSHX group, P < 0.05. Compared with the Ctrl group, #P < 0.05, and compared with the H/R group, ∗P < 0.05.
