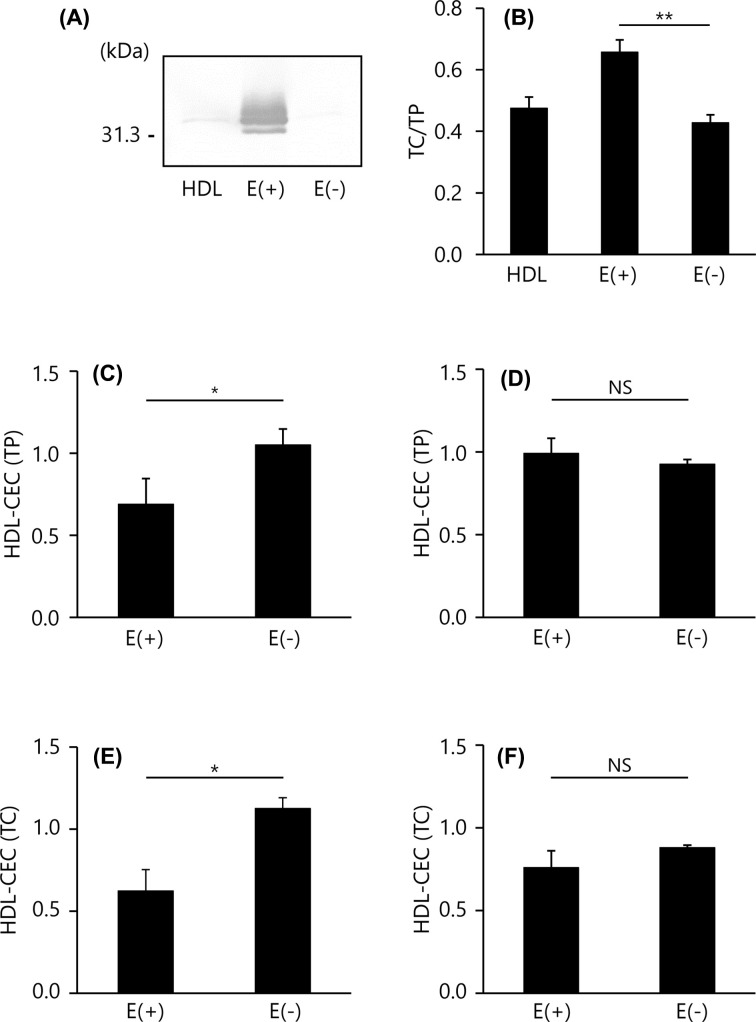
Figure 3. CEC of apoE-containing HDL and apoE-deficient HDL.
(A) ApoE content in HDL subfractions were determined by SDS/PAGE and Western blotting (0.2 μg TP/lane). (B) The content of TC in whole HDL (HDL), apoE-containing HDL (E(+)) and apoE-deficient HDL (E(−)) were determined as ratios relative to TP content. (C–F) CEC was evaluated using 20 μg TP/ml or 1 mg TC/dl of each HDL subclass by the ILG (C,E) and conventional (D,F) method. The results were indicated as the ratio to CEC of whole HDL. All samples were assayed in triplicate. Values are presented as means ± SD (n=3). *P<0.05 by paired t tests. Abbreviation: NS, no significance.

