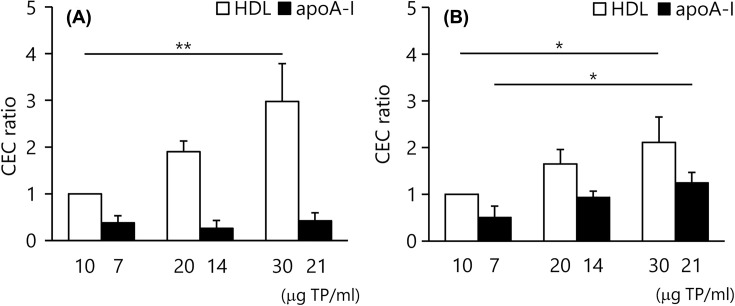
Figure 5. CEC of apoA–I.
CEC of HDL (10, 20 and 30 μg TP/ml, open bar) and apoA–I (7, 14 and 21 μg TP/ml, closed bar) were determined by the ILG (A) and conventional (B) methods. The results were indicated as the ratio to CEC of 10 μg HDL. All samples were assayed in triplicate. Values are presented as means ± SD (n=3) *P<0.05 and **P<0.01 by repeated-measures ANOVA with Bonferroni correction. Abbreviation: ANOVA, analysis of variance.

