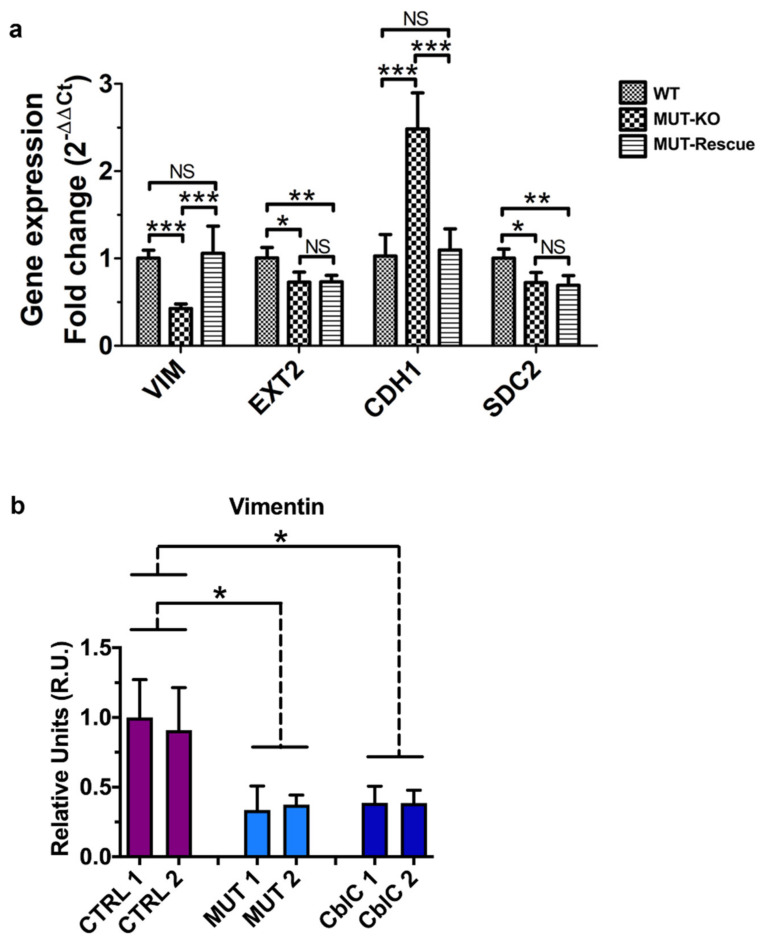
Figure 7.
Gene expression analysis of validated proteins and immunodetection of VIM protein in the urine from patients. (a) Transcript levels of the proteins validated by the WB analysis were measured by qRT-PCR in the analyzed cell lines. Relative gene expression levels were normalized to those of RNA polymerase II, α-tubulin, and β-actin genes and calculated using the 2−ΔΔCt method and reported as fold-change. Bars are the mean of four biological replicates while bar errors indicate SD. Statistical significance was calculated by a one-way two-tail unpaired t-test; *: p < 0.05; **: p < 0.01; ***: p < 0.005; NS: Not significant (p > 0.05). (b) Vimentin expression was tested by WB in the urine of MMA patients (MUT). Healthy donors (CTRL) were used as controls; MMA with homocystinuria CblC type patients (CblC) were used as an additional control. Bars are the mean of three independent experiments; bar errors indicate SEM. Statistical significance of MUT and CblC groups was calculated with respect to CTRL by a one-way two-tail unpaired t-test; *: p < 0.05.

