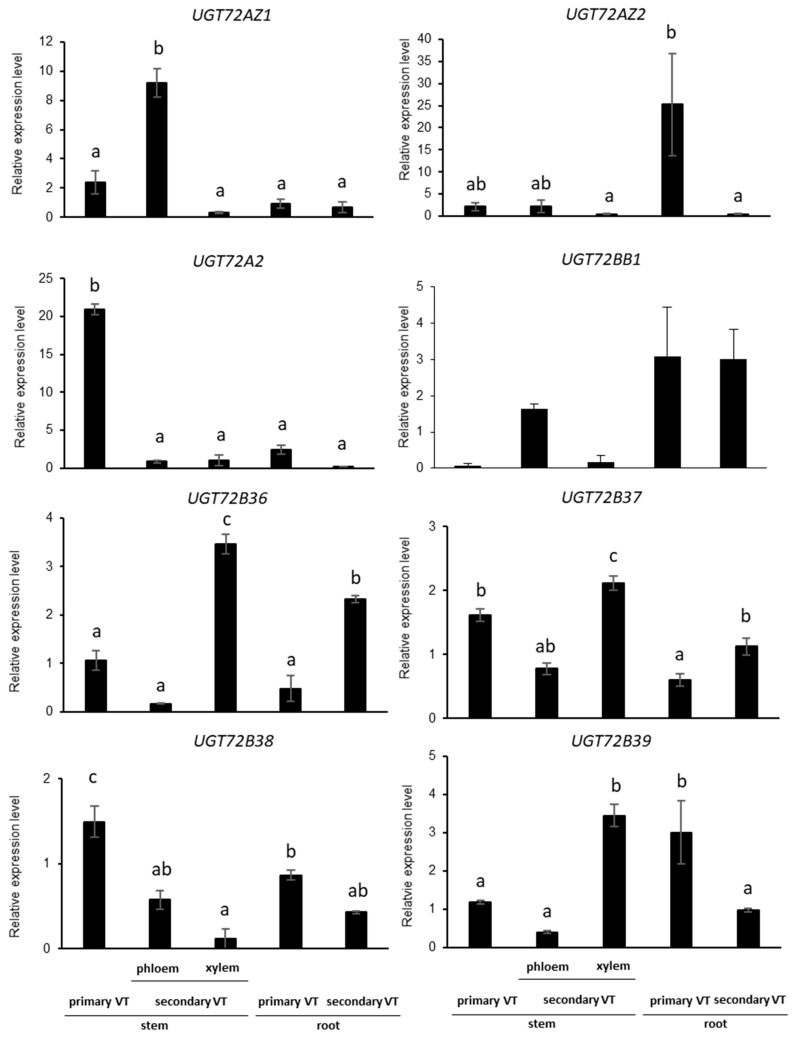
Figure 5.
RT-qPCR expression profile of UGT72s in different parts of 4-month-old poplar trees grown in the greenhouse. Normalized relative expressions are means of 3 biological replicates (± SE). Significantly different values (p < 0.05) are represented by different letters (ANOVA and Tukey post hoc test). VT, vascular tissue.

