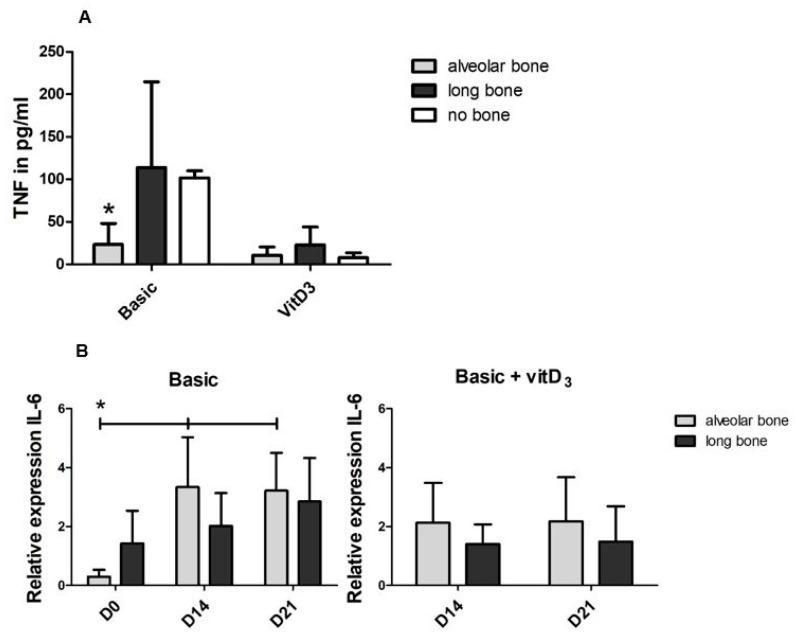
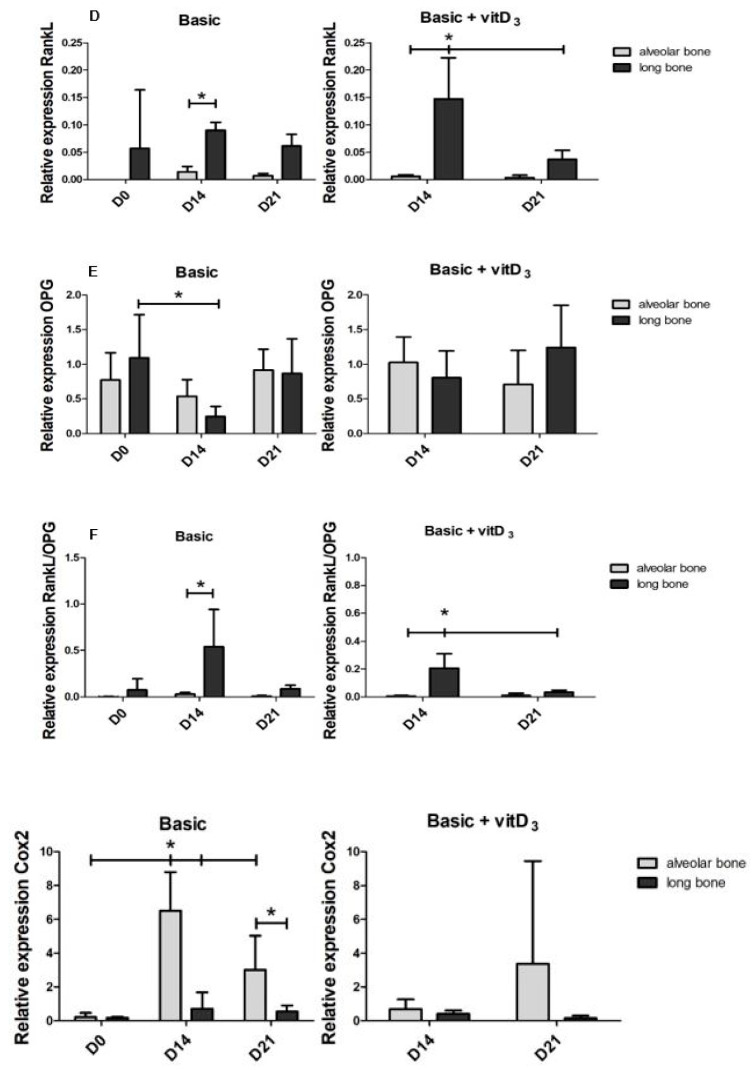
Figure 5.
Differences in the proteins and the genes involved with osteoclastogenic differentiation in the alveolar bone cells and the long bone cultures. Graphs depict the basic medium and the basic medium + vitD3 (A) Concentration of TNF-α in media at day 7. (B) Relative expression of IL-6. (C) Relative expression of RankL. (D) Relative expression of osteoprotegerin (OPG). (E) The ratio RankL/OPG gives an indication for osteoclast activation. (F) Relative expression of COX2. Significance was measured using a 2-way ANOVA with Bonferroni post-tests. * p < 0.05.


