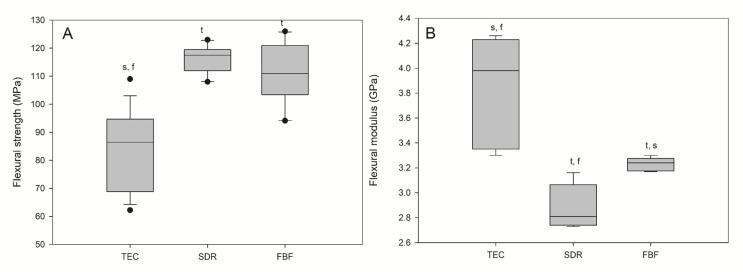
Figure 5.
Flexural strength (A) and flexural modulus (B) of tested materials. Box plots are shown with median in solid line, whiskers represent maximum/minimum values, and solid dots represent 5th/95th percentiles. Statistically significant difference: t = p < 0.05 vs. TEC, s = p < 0.05 vs. SDR, f = p < 0.05 vs. FBF (n = 5).

