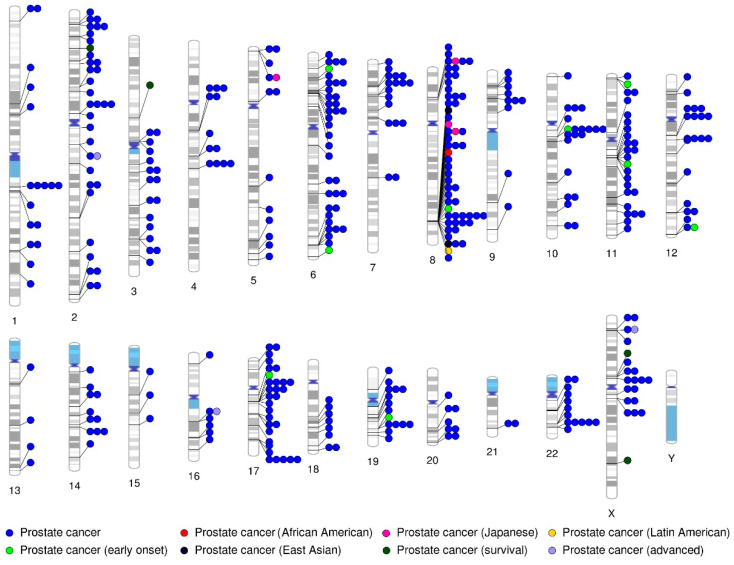
Figure 2.
PrCa risk loci identified by genome-wide association studies (GWAS). The circles represent the location of loci significantly associated with PrCa risk (p-value ≤ 5.0 × 10⁻⁸) along the genome, divided into separate chromosomes. Data retrieved from the NHGRI-EBI Catalogue of published GWAS (http://www.ebi.ac.uk/gwas) and plotted using the PhenoGram software.

