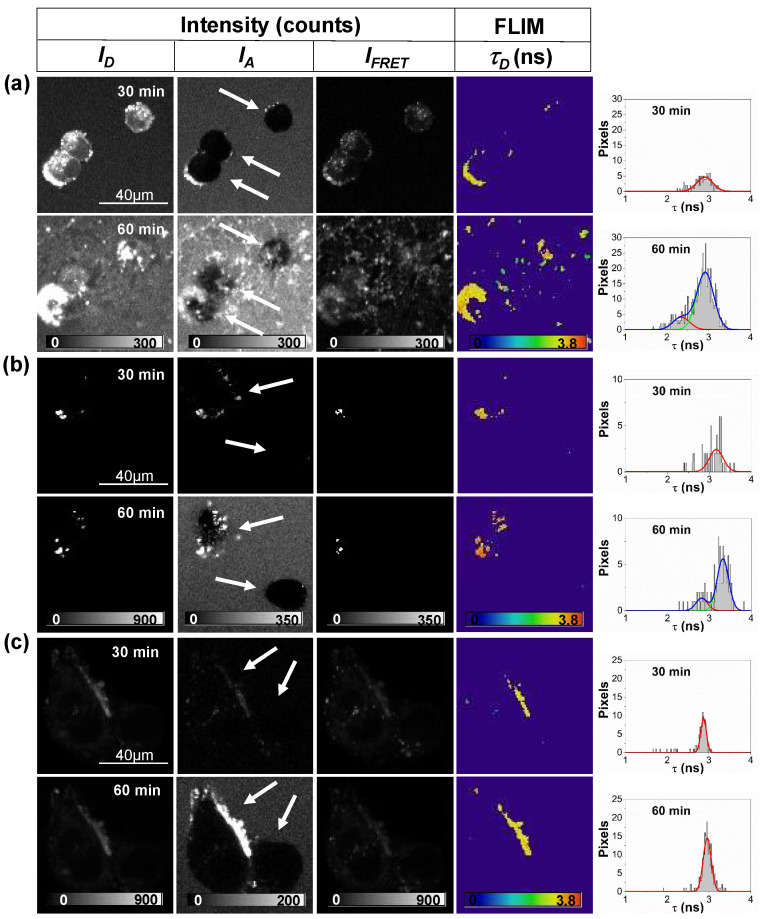
Figure 2.
Fluorescence intensity images in the three detection windows (ID, IFRET, and IA) and FLIM images of the donor fluorophore, τD, of equimolar mixtures of labeled Aβ-488 and Aβ-647 peptides (incubated for 15 h) interacting with Neuro-2a (N2a) cells for 30 and 60 min. Histograms in the rightmost column represent τD distributions for only pixels selected as aggregates. The distributions were fitted to one or two (if needed) Gaussian functions (lines). Panels (a–c) are representative images from different, repeated experiments. The arrows indicate different detected cells for identification purposes.

