Figure 5.
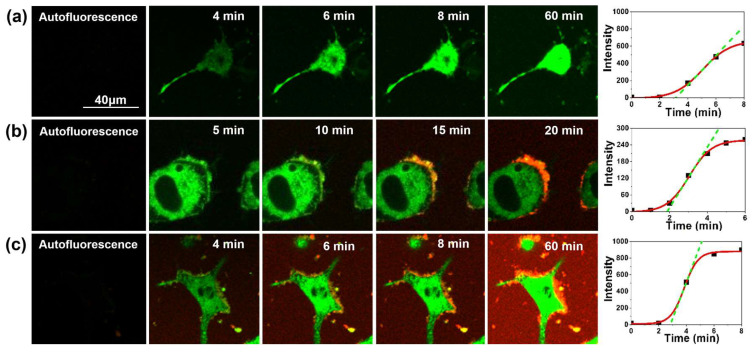
Representative images of cellular stress assays with the biothiol probe (green channel) at different times without control, (a) or with the addition of Aβ-647 aggregates (red channel) previously incubated for 24 h (b) and 48 h (c). The plots in the rightmost column represent the corresponding average intensity per pixel value of the biothiol probe as a function of time along with the fitted sigmoidal function (red curve) and the slope at the inflection point (green, dashed line).

