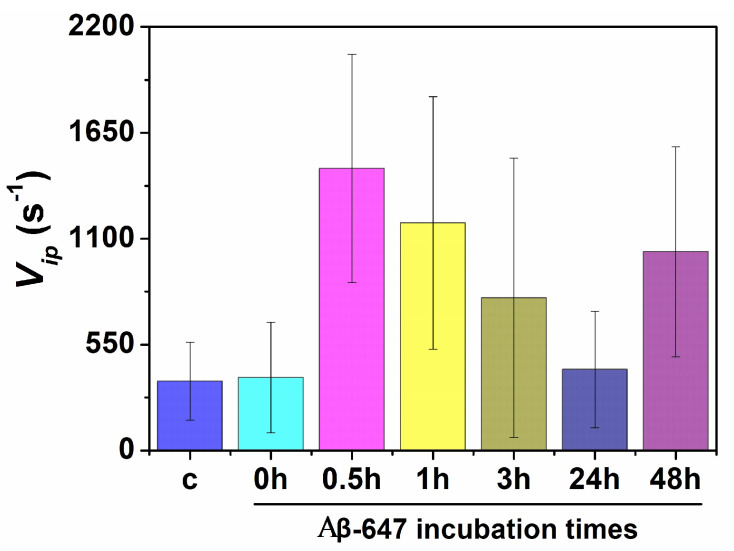
Figure 6.
Biothiols sensing in cells interacting with Aβ-647 aggregates formed at different incubation times. The bar chart represents the average rate of the fluorogenic biothiol sensing reaction at the inflection point (vip) for the controls (labeled as c) and for the cells interacting Aβ-647 aggregates formed at different incubation times (0, 0.5, 1, 3, 24, and 48 h of incubation). Error bars represent standard error of the mean (s.e.m.).

