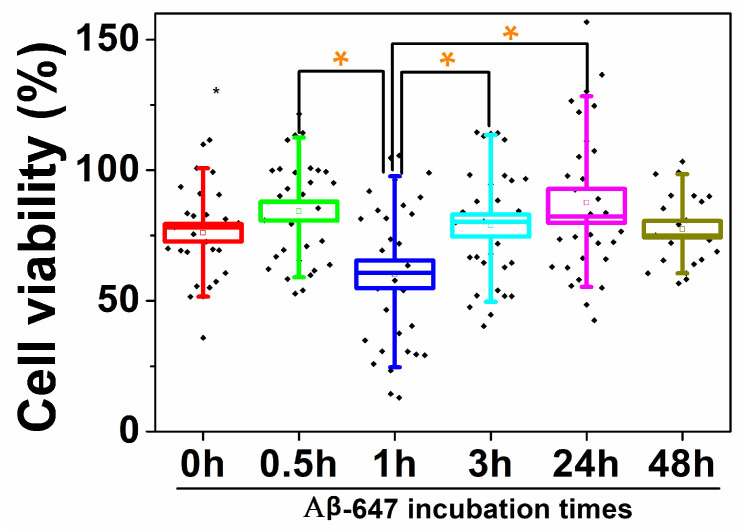
Figure 7.
Box and whisker plot representing N2a cell viability upon the addition of Aβ-647 aggregates incubated for different times, expressed as the percentage of cell viability when compared with that in the control cells in the absence of aggregates. Boxes represent the standard error of the mean, and whiskers represent 90% of the results. Orange asterisks indicate populations that are significantly different from each other, with a 95% confidence interval.

