Figure 1.
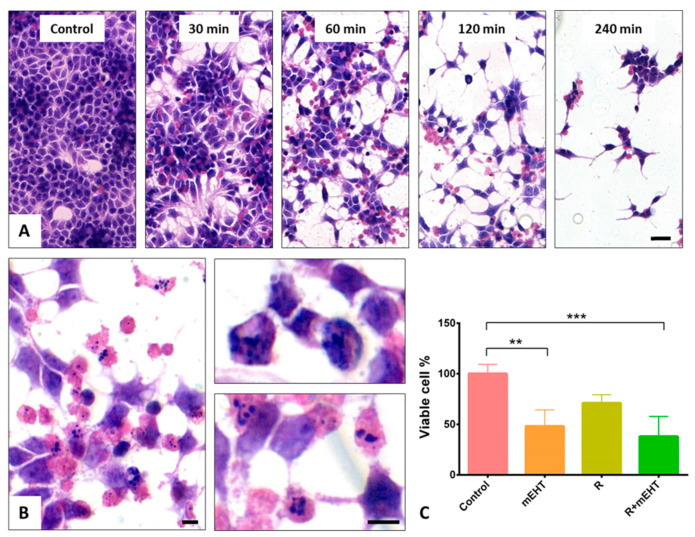
Hematoxylin and eosin staining of Panc1 cell cultures demonstrating cell loss and the major changes in cell morphology 24 h after different mEHT treatment durations (A). Scale bar: 40 µm. Higher magnifications reveal nuclear shrinkage, chromatin condensation (upper right) and apoptotic bodies (lower right) after 60 min treatment (B). Scale bars: 10 µm. Significant reduction in viable cell numbers, detected using trypan blue staining, both after 60 min mEHT monotherapy (p = 0.014), and after combination of mEHT and 2 Gy radiation (R+mEHT) (p = 0.0029) but not after radiotherapy alone (R). Kruskal–Wallis test reveals significant difference (p = 0.0007) among the 4 groups (C). The asterisks mark the value of p: ** means p ≤ 0.01, *** means p ≤ 0.001.

