Figure 3.
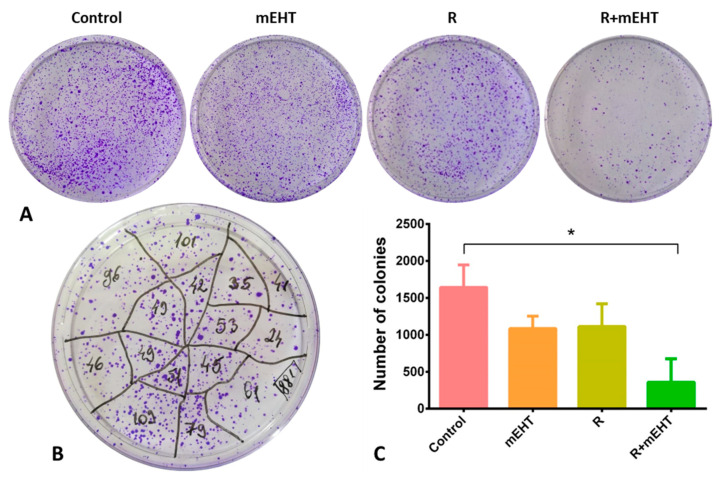
Clonogenic assay after different treatments of Panc1 tumor cells. Representative images of formalin-fixed, crystal violet stained colonies 8 days after treatment (A). Reliable counting of the colonies was based on dividing the plate areas into segments (B). Statistical analysis revealed a significant reduction after R+mEHT treatment compared to the control group (p = 0.0195) (C). Kruskal–Wallis test also showed a significant difference among the 4 groups (p = 0.0064) TER = 3.1. The asterisk (*) marks the value of p ≤ 0.05.

