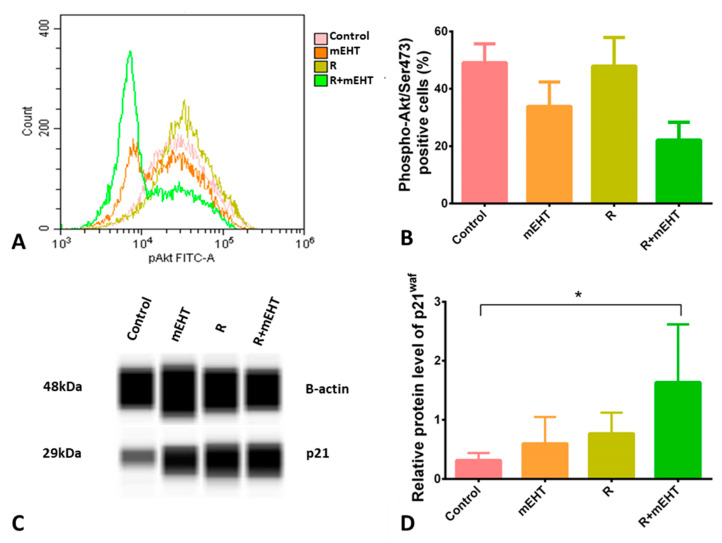
Figure 4.
Treatment induced reduced p-Akt/Ser473 and elevated p21waf1 levels in Panc1 cultures 24 h post-treatment. Flow cytometry histogram (A) and quantitation graph of p-Akt/Ser473 levels. Kruskal–Wallis test revealed a significant difference (p = 0.015) among the 4 groups (B). p21waf1 protein expression detected in Western blots (C). Kruskal–Wallis test (p = 0.049) revealed a significant difference among groups. Dunn’s post-hoc test confirmed a significant increase in p21waf1 level in the R+mEHT group compared to the control (p = 0.045) (D). The asterisk (*) marks the value of p ≤ 0.05.

