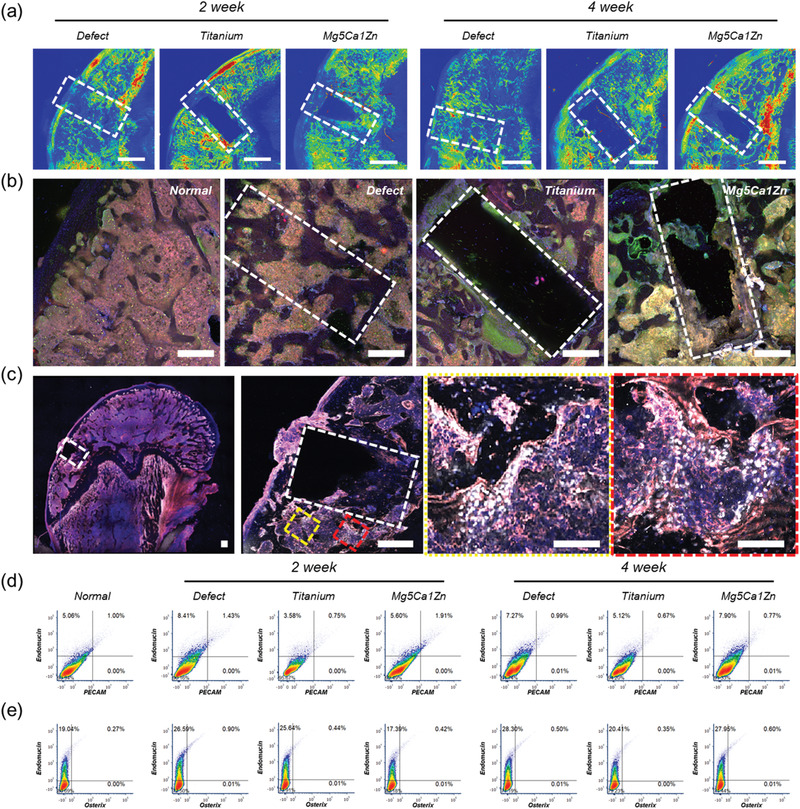
Figure 2.

a) SHG images of normal SD rat femur, empty defect site, titanium, Mg5Ca1Zn samples after 2 and 4 weeks postoperation. Scale bar represents 1 mm in length and white dash lines represent the original defect created during surgery. Green and Red colors represent the increasing concentration of collagens detected by the SHG. b) Confocal microscopy images of immunostained sections from normal bone, empty defect site, titanium, Mg5Ca1Zn samples after 4 weeks postoperation (Endomucin—Red, Osterix—Green, DAPI—Blue). Scale bars, 500 µm. c) High resolution confocal microscopy images of immunostained sections Mg5Ca1Zn samples after 4 weeks postoperation (Endomucin—Red, Osterix—White, DAPI—Blue). Scale bar, 500 µm. Yellow and red dotted square areas indicate magnified regions with scale bars 200 µm. d) Flow cytometry dot plots showing expression of PECAM and Endomucin from the cells collected from femoral head of SD rats with empty defect site, Titanium or Mg5Ca1Zn after 2 and 4 weeks postoperation. e) Flow cytometry dot plots showing expression of Osterix and Endomucin from the cells collected from femoral head of SD rats with empty defect site, Titanium or Mg5Ca1Zn after 2 and 4 weeks postoperation.
