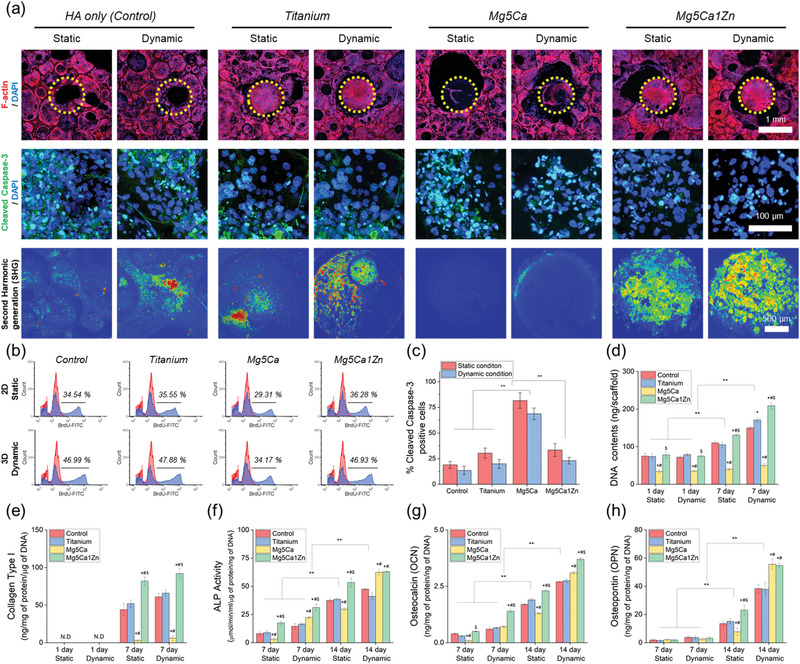
Figure 4.

a) Cytoskeletal structures hFOBs after 24 h of culture on the HA, Mg‐based alloy implanted HA and titanium implanted HA. The images were acquired by fluorescence staining for F‐actin (red), and DAPI (nuclei). Representative images of hFOBs stained for Cleaved Caspase‐3. The images were acquired by fluorescence staining for Caspase‐3 (green), and DAPI (nuclei). Second harmonic generation (SHG) imaging of cells on metal alloy. b) FACS results of hFOB proliferation after 24 h of culture under static and dynamic conditions using control HA, HA implanted Titanium and HA implanted with two different type of Mg‐based alloys. c) Quantification of apoptosis from each sample. d) Quantification of DNA contents. e) ELISA analysis of the Collagen I content of cells on metal alloy. Quantification of production of f) ALP, g) OCN and h) OPN bone protein. “*,” “#,” and “$” indicate significant differences compared to Control, Titanium and Mg5Ca, respectively (p < 0.05). ** indicates significant difference (p < 0.05).
