
Figure 1.
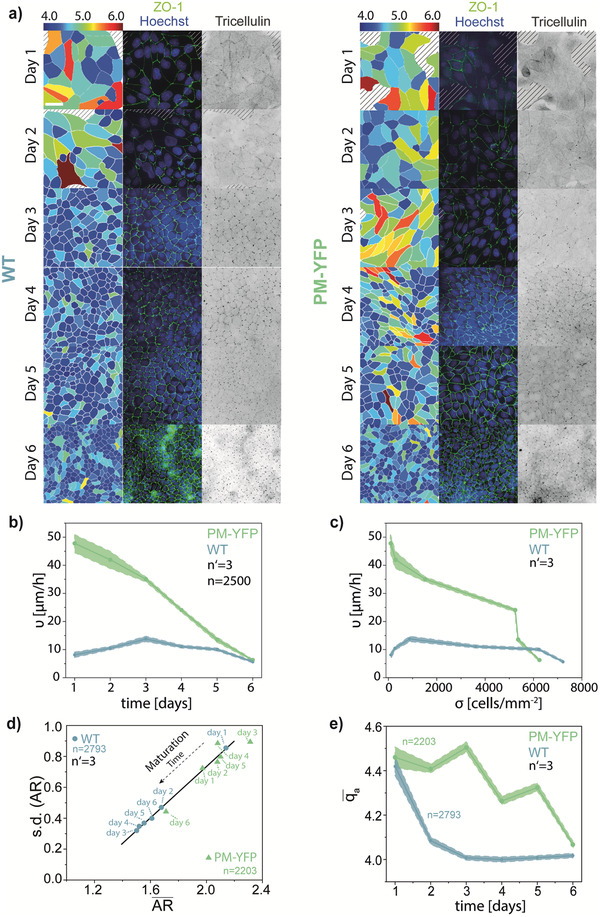
Maturation and jamming behavior of the monolayer of WT and PM‐YFP MDCK cells. a) Representative images of the maturation of the monolayer at days 1–6 of WT and PM‐YFP MDCK cells. Left panels: from the ZO‐1 immunostaining, the image was segmented and cells colored according to the apical shape index (q a = p a/√A a). A color scale is shown on the top. Middle panels: immunostaining for nuclei (Hoechst, blue) and ZO‐1 (green). Right panels: inverted image of the immunostaining for tricellulin. Scale bar: 50 µm. b) Cell migration velocity, v, with respect to time. c) Cell migration velocity, v, with respect to cell density σ. Shaded areas indicate the standard error of the mean. d) Variation of the mean cell aspect ratio () and of its SD (AR) with increasing days of maturation for WT and PM‐YFP MDCK. e) Evolution of the mean apical shape index () over time.