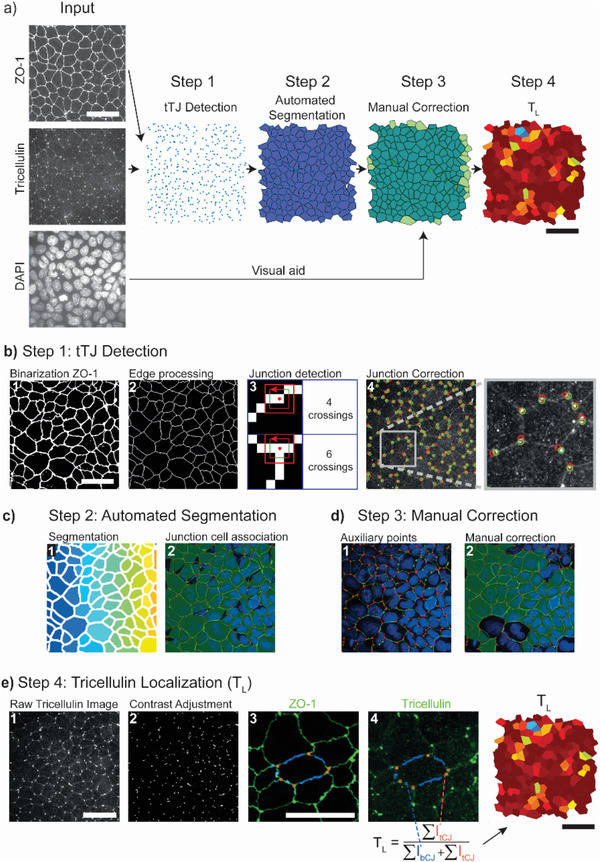
Figure 2.

A custom software yielding quantitative measures of tricellular junction maturation. a) Overview of the four steps for tricellulin detection and cell segmentation. b) Step 1: tricellular junction (tTJ) detection: creation of a binary image (1) from the ZO‐1 staining is followed by image processing to reduce edges to single pixel lines (2). A pixel‐counting algorithm (3) is used to determine nodal points where three cells meet. The location of tricellular junctions is corrected (4) using a point source detection algorithm on the raw tricellulin staining. c) Step 2: automatic segmentation: segmentation of the single line edge image (b2) determines pixel regions for each cell (1). Polygonal representations (2) of each cell are created from associated junctions. d) Step 3: manual correction: auxiliary points to improve the shape of cells can be manually added (1) and cell shapes corrected (2). e) Step 4: tricellulin localization: the tricellulin image (1) is contrast adjusted (2). The masks for bicellular junctions (3) are determined from the combination of the cell polygon with the binarized ZO‐1 staining. Tricellulin localization is used as proxy of tTJ maturation (4). It is defined as the ratio of average pixel intensity of tricellular junctions (orange) to that of bicellular junctions (blue). Scale bars: 50 µm.
