Figure 5.

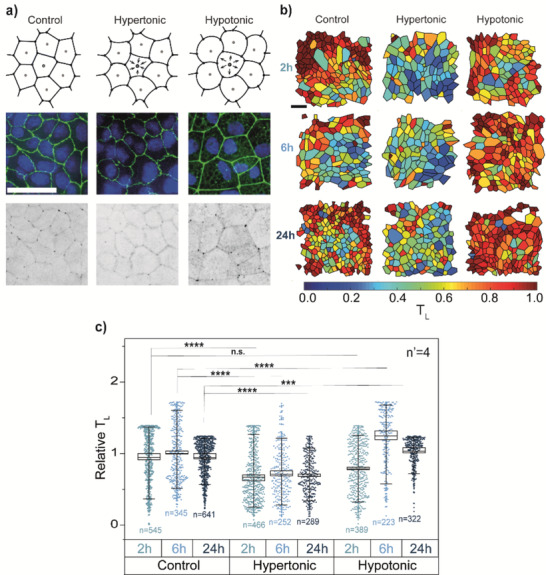
Influence of cell medium osmolarity on tricellulin localization. a) Top row: schematic representation of the effect of cell medium osmolarity on cell volume in WT MDCK monolayers. Middle row: representative combined image of ZO‐1 (green) and nuclei (Hoechst, blue) staining. Bottom row: representative inverted image of tricellulin staining. From left to right: control, hypertonic and hypotonic medium. Scale bar: 50 µm. b) Representative segmentation of cells at 2, 6, and 24 h of treatment. Cells are colored according to their tricellulin localization (T L). Scale bar: 50 µm. c) T L values for 2 h (blue), 6 h (light blue), and 24 h (dark blue) after addition of control (left), hypertonic (middle) or hypotonic medium (right). Values of T L are normalized to the control at 6 h. ***p < 10−3; ****p < 10−6.
