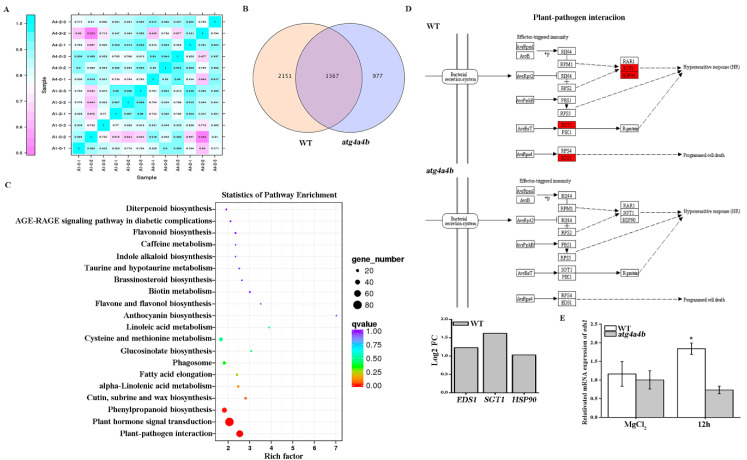
Figure 2.
Enhanced disease susceptibility 1 (EDS1) was up-regulated under AvrRpt2 infection. (A) Correlation between RNA-Seq samples. A 1-0-1/2/3 represent three replicates of WT, A 1-2-1/2/3 represent three replicates of WT infected with AvrRpt2, A 4-0-1/2/3 represent three replicates of atg4a4b and A 4-2-1/2/3 represent three replicates of atg4a4b infected with AvrRpt2, heat maps of the correlation coefficient between samples, the number represent R2 that means the square of the Pearson coefficient. (B) Venn diagram of expressed genes in WT and atg4a4b when infected with AvrRpt2. FPKM > 1 is the expression threshold. (C) Transcriptome analysis of Kyoto Encyclopedia of Genes and Genomes (KEGG) enrichment in WT and atg4a4b when infected with AvrRpt2 for 12 h. (D) Transcriptome analysis of KEGG pathway of plants and pathogens interaction. The red color means that the expression was up-regulated. (E) The mRNA expression of EDS1 in WT and atg4a4b. Each data is three independent replicates. Each value is the mean ± SD of three replicates. Statistically significant differences between treatments (* p < 0.05).

