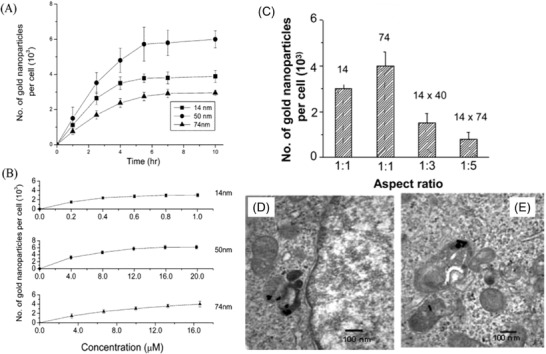
Figure 11.

Cellular uptake kinetics of AuNPs. A) Cellular uptake of AuNPs (14, 50, and 74 nm) as a function of incubation time. B) Dependence of cellular uptake of AuNPs as a function of concentration. C) Comparison of uptake of rod‐shaped NPs and spherical shaped NPs (with aspect ratio 1:3 and 1:5), D,E) the transmission electron microscopy images of rod‐shaped NPs (D—1:3, E—1:5) internalized within Hela cells. Adapted with permission.[ 202 ] Copyright 2006, American Chemical Society.
