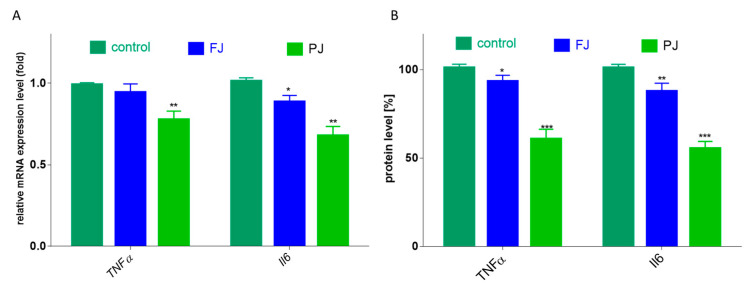
Figure 9.
The influence V. opulus FJ and PJ at IC0 on mRNA expression, quantified with real-time PCR and normalized using glyceraldehyde-3-phosphate dehydrogenase (GAPDH) as a reference gene (A) and protein secretion quantified with ELISA (B) of TNFα and Il6 in Saos-2 cells after 8 days of exposure; control cells were not exposed to any compound; values are means ± SEM, n = 4; statistical significance was calculated versus control cells * p ≤ 0.05, ** p ≤ 0.01, *** p ≤ 0.001.

