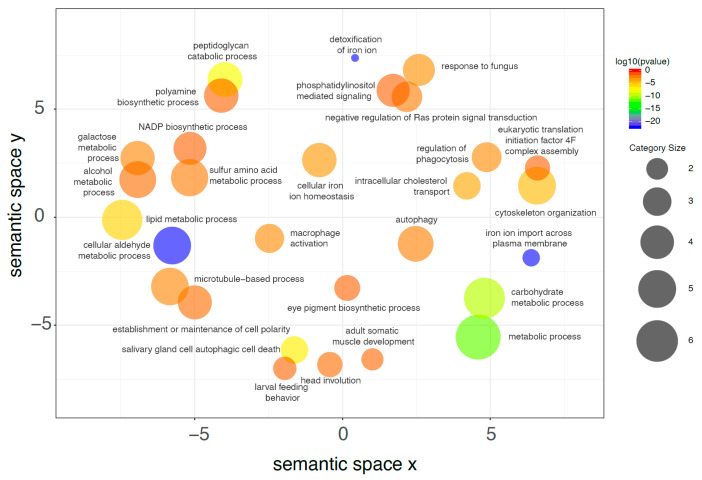
Figure 8.
Downregulated genes associated to the GO category “Biological Processes”. Starting from the enrichment analysis of genes that are downregulated in midguts of larvae reared on VMD compared to SD, REVIGO was used to group similar biological processes on the basis of the SimRel semantic similarity metric; in this way categories with similar descriptions are close in the plot. As shown in the scale on the right, the color of the bubble identifying each biological process is a function of log10 (p value) for the false discovery rate for the enrichment of each process. Bubble size indicates the frequency of each GO term (larger size indicates larger categories) and was calculated by REVIGO on the basis of the size of each category in a background database (SwissProt [42]). Only categories with FDR ≤ 1.0 × 10⁻³ were selected, see full list in Supplementary Tables S3–S7.

