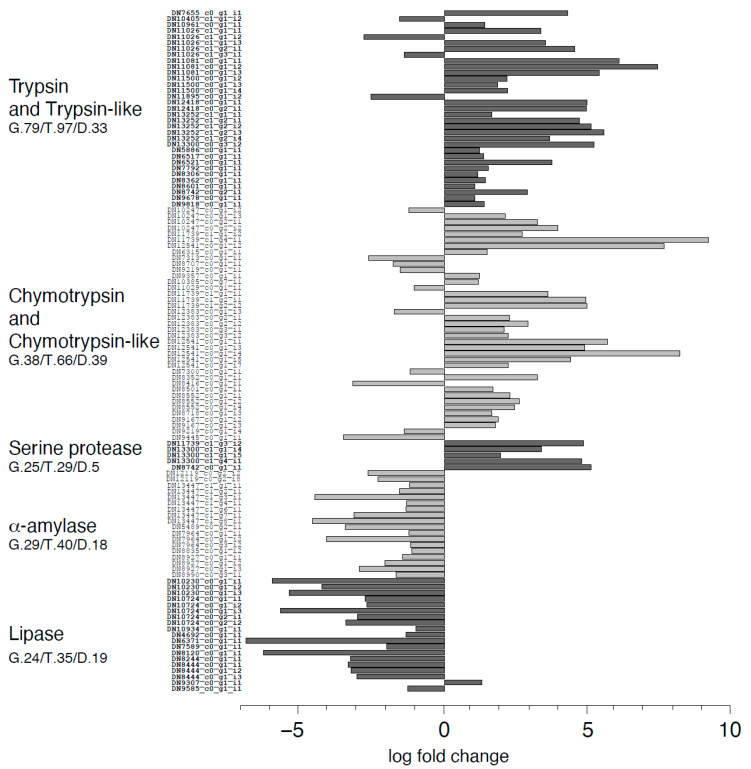
Figure 9.
Log fold change of differentially expressed transcripts assigned to molecular functions corresponding to hydrolytic activity related to digestion in midguts of larvae reared on VMD compared to SD. For each function the number of genes (G.), transcripts (T.), and transcripts differentially expressed (D.) identified by the transcriptome analysis are shown together with their log fold change in our transcriptomic data.

