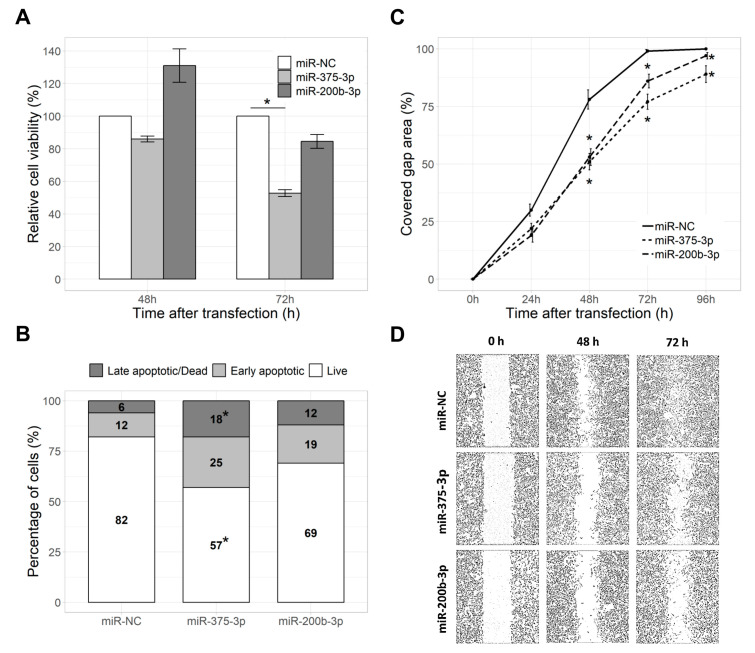
Figure 4.
Effect of miR-375-3p and miR-200b-3p on cell viability, migration and apoptosis: (A) Barplot represents changes in cell viability 48 h and 72 h after transfection with miRNA mimics relative to cells transfected with mimic negative control, (B) stacked barplot represents the percentage of live, early apoptotic or late apoptotic/dead cells 72 h after transfection with miRNA mimics and (C) line plot shows cell migration rates, represented as the percentage of the covered gap area, measured 0–96 h after transfection with miRNA mimics. (D) Microscopic images of the closing gap in the wound healing assay illustrating differences in the cell migration rates after transfection with miRNA mimics. Data from three to five independent experiments. *—p < 0.05.

