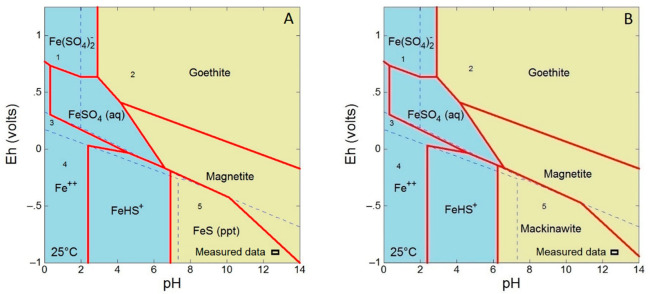
Figure 3.
Eh–pH diagrams for the Fe-S-H2O system at 25 °C with amorphous (A) FeS and (B) mackinawite phases shown. The total Fe is 6 × 10⁻⁵ mol L–1, and the total S is 2 × 10⁻¹ mol L–1. Blue and yellow fields represent dissolved species and mineral phases, respectively. Mackinawite is supressed in (A) and FeS (ppt) is supressed in (B). Hematite and pyrite are supressed in both diagrams. Dotted lines and numbers indicate speciation fields of S: 1 HSO4–, 2 SO42–, 3 rhombic S0, 4 H2S (aq), and 5 HS–. The position of the measured data is indicated by a rectangle at the bottom right.

