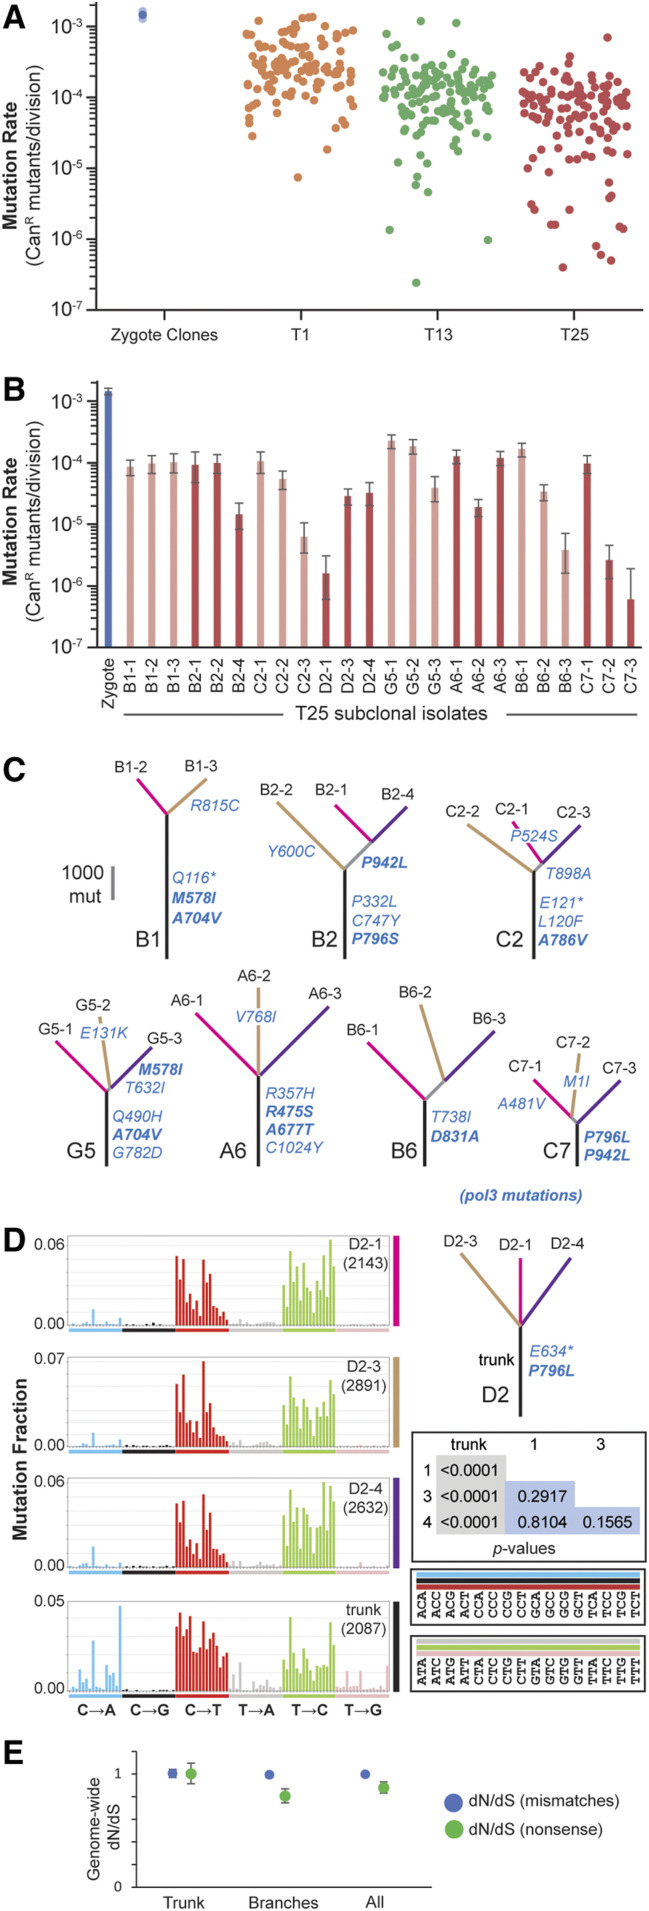
Figure 4.
Strong diploid mutators adapt through antimutator alleles. (A) Mutation rates of pol3-01/pol3-01 msh6Δ/msh6Δ subclones. Single-cell subclones were isolated after the first (T1), 13th (T13), and 25th (T25) transfers. Mutation rates were determined by a canavanine resistance (CanR) fluctuation assay (see Dataset S1 for mutation rates and 95% C.I.s). Solid circles, mutation rates; transparent circles, 95% C.I.s. (B) Variation in mutation rates depicted in (A) of T25 subclones from the same culture. Alternating shades of red indicate groups of subclones. (C) Phylogenetic trees of subclones depicted in (B) based on whole-genome sequencing. Observed pol3 mutations are in blue lettering using single-letter amino acid codes: *, nonsense mutation; bold type, known or likely antimutators. (D) Representative mutation spectra of shared (trunk) and unique mutations [see Figure S7 for mutation spectra of all trees in (C)]. Each mutation site (represented here by the pyrimidine base T or C) was categorized into one of the 96 mutation types created by subdividing the six general mutation types (C→A, C→G, C→T, T→A, T→C, T→G) into the 16 possible trinucleotide contexts (see boxes to the lower right for contexts; blue, black, and red bars correspond to mutation sites involving C; gray, green, and pink bars correspond to mutation sites involving T). Bar heights correspond to the fractions mutation types represent of the total mutations (given in the right-hand corner of each plot). Inset table: P-values of the hypergeometric test of similarity between mutation spectra. (E) Genome-wide (global) ratios of nonsynonymous and synonymous mutations (dN/dS) of trunk and branch mutations.

