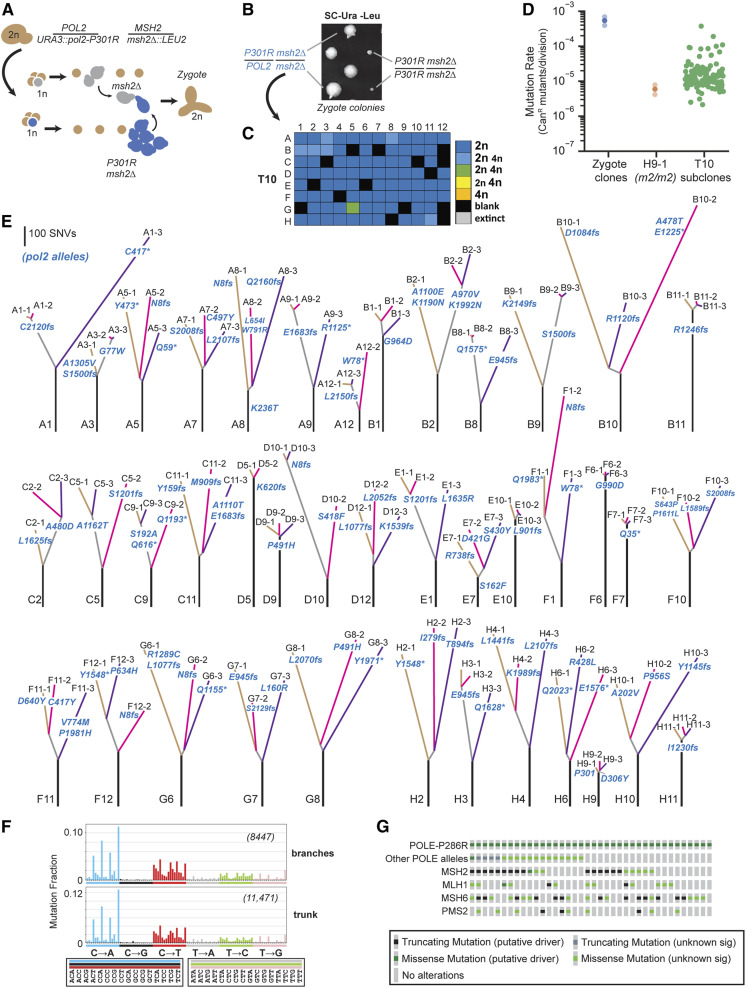
Figure 5.
Modeling adaptation of POLE-P286R mismatch repair-deficient cancers to EEX. (A) Isolation of pol2-P301R/POL2 msh2Δ/msh2Δ zygotes. POL2 msh2Δ spores slowly divide once on SC-Ura-Leu media, allowing mating with more rapidly dividing pol2-P301R msh2Δ cells. (B) Representative growth phenotypes of the initial zygote colonies (see Figure S8 for all colonies). (C) Ploidy of evolved cultures after 10 (T10) serial transfers. Colors of boxes indicate the ploidy or mixture of ploidies of each culture: dark blue, 2n cells; light blue, more 2n than 4n; green, equal numbers of 2n and 4n; yellow, more 4n than 2n; orange, 4n; black, blank; gray, censored. (see Dataset S1 for histograms). (D) Mutation rates as determined by a canavanine resistance (CanR) fluctuation assay (see Dataset S1 for mutation rates and 95% C.I.s). Solid circles, mutation rates; transparent circles, 95% C.I.s (for zygote clones only). (E) Phylogenetic trees based on whole-genome sequencing of the subclones. Line length, the number of shared or unique SNVs; lettering at the bottom of each tree, culture position in 96-well plate; lettering at the end of each branch, subclone identifier number; pol2 mutations are in blue lettering: fs, frameshift; *, nonsense mutation. (F) Spectra of grouped mutations from trunks and branches. Format is the same as in Figure 4. Trunk spectrum determined from all trunk mutations combined. Branch spectrum determined from combined mutations from branches with truncating mutations at E945 or before (A1-3, A5-1, A5-2, A5-3, A8-1, A12-2, B3-3, C11-1, F1-2, F1-3, F12-2, G6-2, G7-1, H2-2, H2-3, and H3-1/H3-2). (G) Oncoprint of POLE-P286R tumors on cBioPortal showing presence of additional POLE alleles and mutations affecting mismatch repair components (see Dataset S1).

