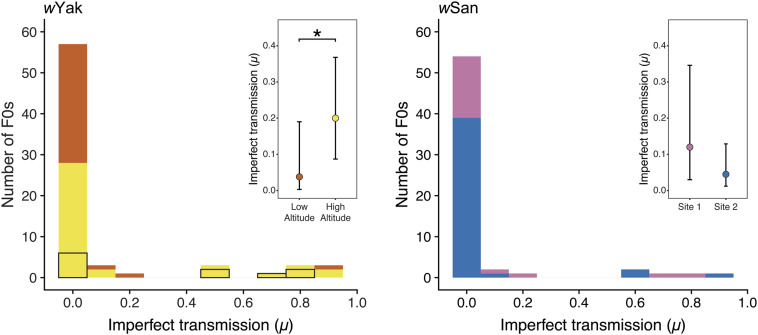
Figure 3.
Histogram of μ for wYak-infected D. yakuba (left) and wSan-infected D. santomea (right) females. The bars are color-coded by region as in Figure 1. For wYak, the contributions of F0 females from the anomalous site YAK05b are outlined in black (see main text). Insets show mean estimates of μ and associated 95% BCa confidence intervals for each region. Asterisk indicates a statistically significant difference in wYak μ between low and high altitude at P < 0.05.

