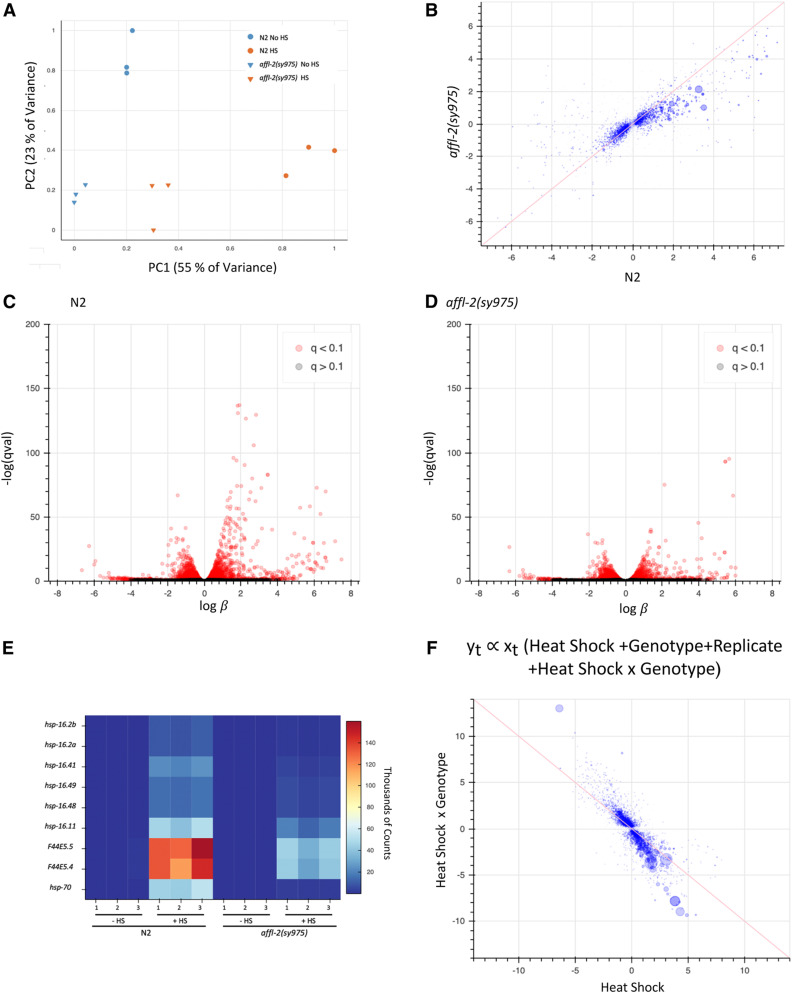
Figure 3.
affl-2(sy975) mutants have a compromised transcriptional response to heat shock. (A) Principal component analysis (PCA) of estimated transcript counts data in RNA-seq samples. (B) Comparison of s, proportional to the log fold-change, due to heat shock treatment for N2 and affl-2(sy975) mutants. is a biased estimator of the fold change due to heat shock treatment. Pearson correlation of plotted data are r = 0.40. Volcano plots for effect of heat shock on N2 (C) and affl-2 (sy975) (D). (E) Heat map of estimated transcript counts for hsp-16 and hsp-70 genes. (F) Comparison of s corresponding to heat shock treatment and to interaction between heat shock and genotype. Pearson correlation of plotted data are r = −0.71. In scatter plots (B) and (F), pink line is at x = y and x = -y respectively, and size of points is proportional to the −log(qval) of a given gene.

