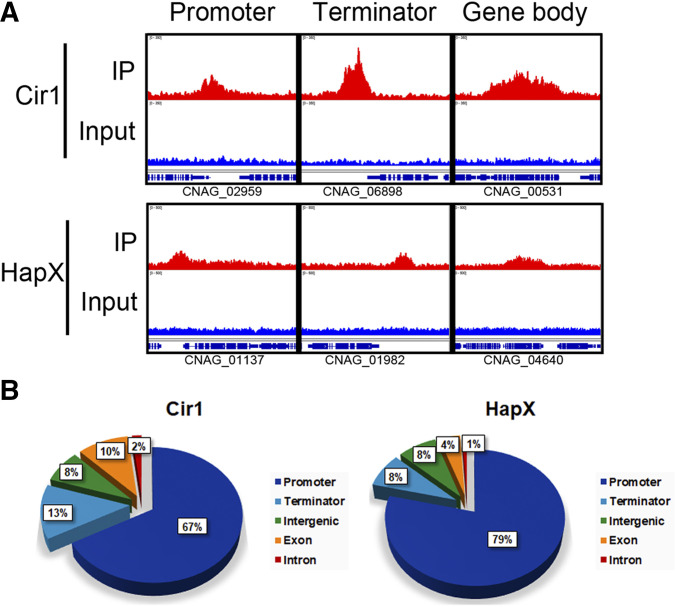
Figure 1.
Analysis of the genomic distribution of the sequences bound by Cir1 and HapX. (A) Peak distributions determined by ChIP-seq, as analyzed using Integrative Genomics Viewer. Upper panels (red) show the enrichment of binding of each transcription factor at genomic loci and lower panels (blue) show input controls. (B) Pie charts of genomic distribution of Cir1-and HapX-binding peaks determined by ChIP-seq analysis. IP, immunoprecipitate.

