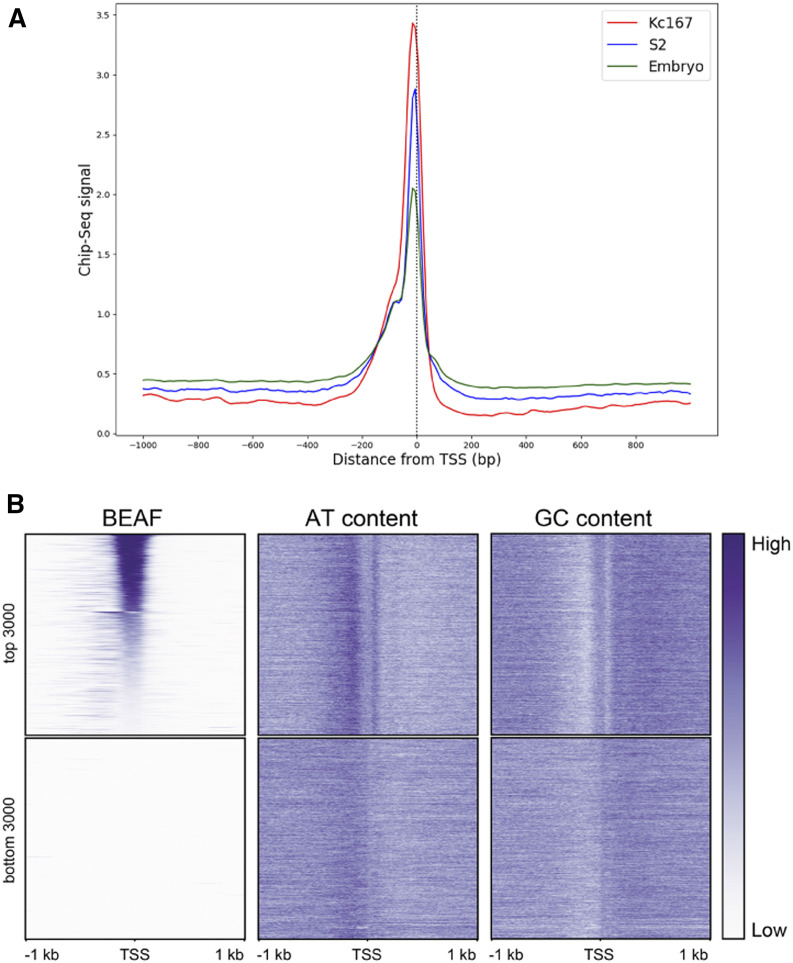
Figure 3.
BEAF binds near TSSs and in AT-rich sequences. (A) Distribution of BEAF binding around TSSs in Kc167 cells (red), S2 cells (blue), and embryos (green). The data are from ChIP-seq experiments (Kc167: SRX749021; S2: SRX386677; embryo: SRX119302). (B) Heatmaps showing, from left to right: BEAF binding signal; AT content; and GC content around TSSs. Top panels: 3000 TSSs arranged from strongest to weakest BEAF signal. Bottom panels: 3000 TSSs lacking significant BEAF signal. Data are for Kc167 cells (SRX749021).

