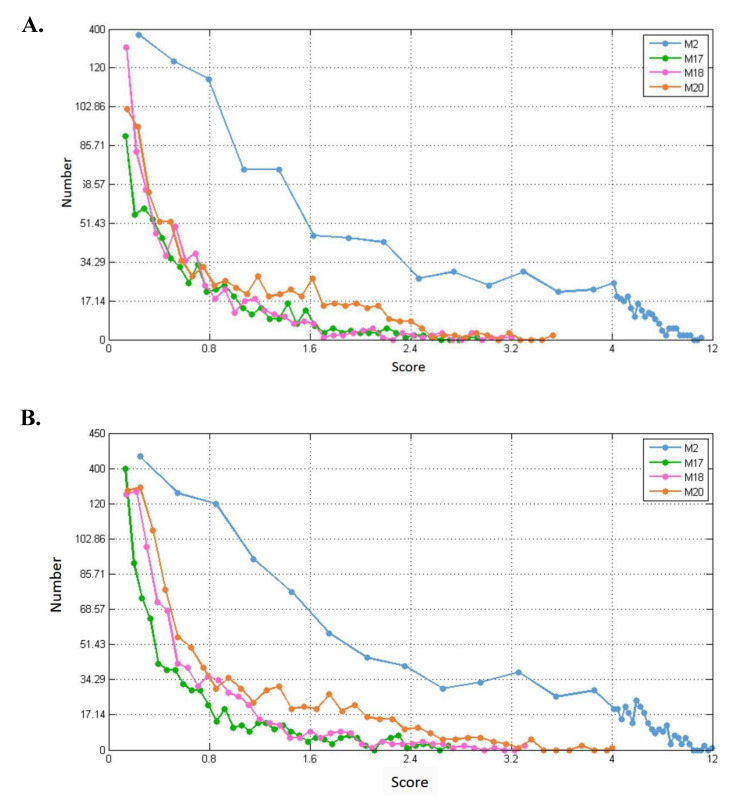
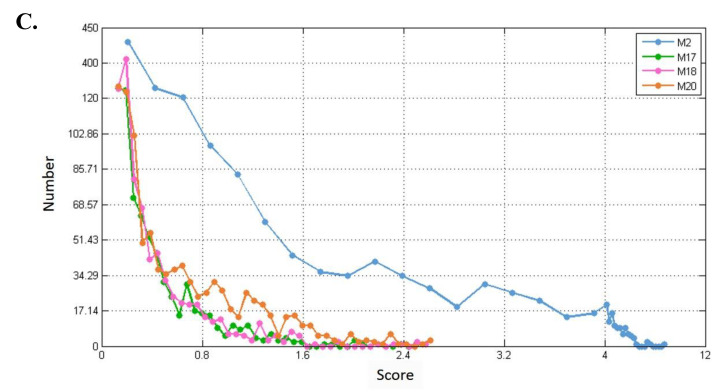
Figure 11.
Distribution of connection strengths between four modules and their corresponding first-order genes in three tissue-specific networks. The X axis represents the connection strength. The Y axis indicates the number of first-order genes of modules. (A–C) show blood, breast, and prostate TSPPI networks, respectively.


