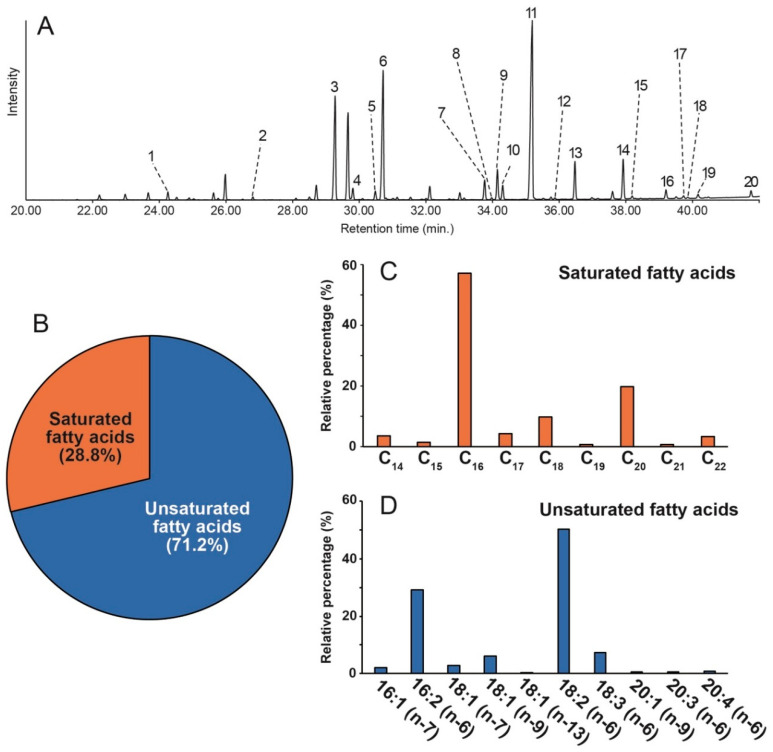
Figure 1.
(A) Total ion chromatogram of extracted fatty acid methyl esters in Chlorella vulgaris obtained by GC−MS analysis (numbers correspond to peak numbers in Table 1) (B) The percentage composition of saturated and unsaturated fatty acid methyl esters (C) Percentage distribution of individual saturated fatty acids relative to the total saturated fatty acid content (D) Percentage distribution of individual unsaturated fatty acids relative to the total unsaturated fatty acid content.

