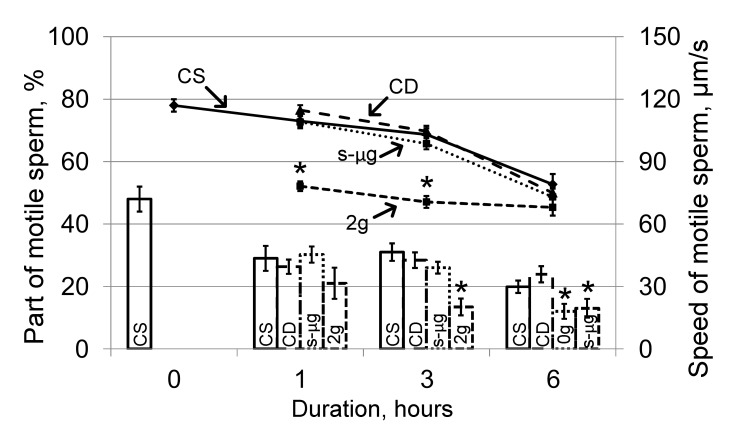
Figure 1.
Portion of motile sperm and the speed after 1, 3 and 6 h of exposure under simulated microgravity and hypergravity (2g). The histogram shows the proportion of motile sperm in each sample (left axis), graph—change in the speed of movement (right axis). CS—static control, CD—dynamic control, s-μg—simulated microgravity conditions, 2g—hypergravity conditions. * p < 0.05 compared with the static control group at the same time point. The data are presented as the mean ± standard error of the mean (M ± SE).

