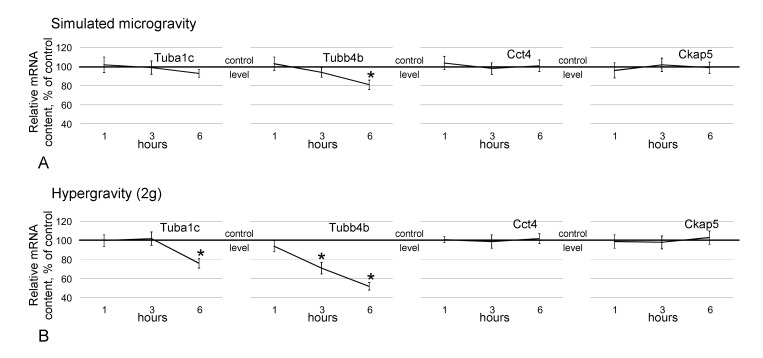
Figure 6.
Relative mRNA content of genes encoding the analyzed cytoskeletal proteins. (A)—genes encoding cytoskeletal proteins under simulated microgravity; (B)—genes encoding cytoskeletal proteins under hypergravity (2g). * p < 0.05 compared with the static control group. The data are presented as the mean ± standard error of the mean (M ± SE).

