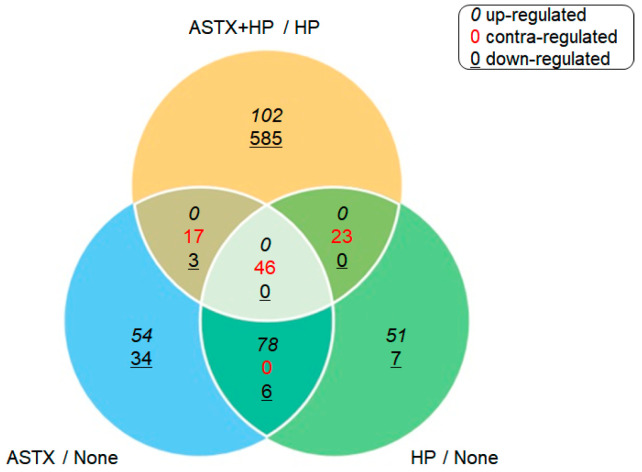
Figure 1.
A comparison of the differentially expressed genes (DEG) expression pattern observed between pairs, and between paired-pairs, of the four experimental groups (None, Helicobacter pylori-infected AGS cells (HP), Astaxanthin (ASTX), and ASTX + HP). The numbers reported in black italic font correspond to upregulated DEGs, the numbers reported in black underlined font correspond to downregulated genes and the numbers reported in red regular font correspond to genes that are upregulated in one set of experimental groups and downregulated in the other.

