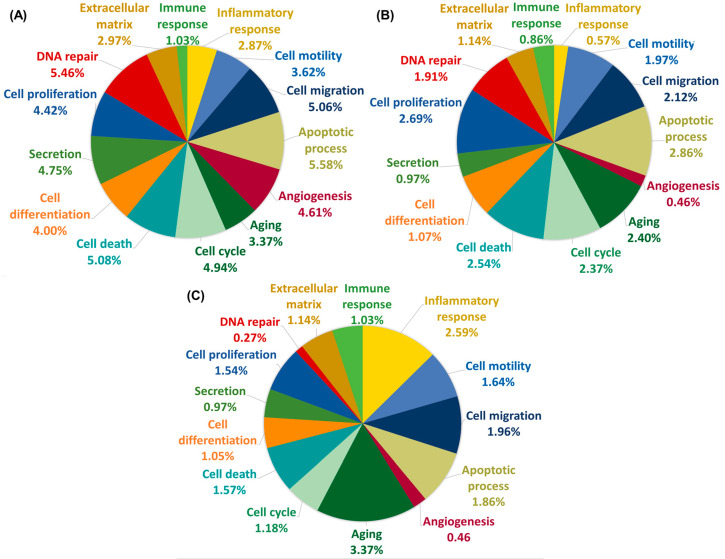
Figure 2.
Pie chart representations of the findings from Gene Ontology (GO) biological process annotation analysis of DEGs associated with None vs. HP (A), or HP vs. ASTX + HP (B), or None vs. ASTX (C). The percent fraction of the DEGs annotated with a particular GO biological process is shown for each of the three pairs of experimental systems compared.

